Plot for confidence interval p - coverage vs p for fixed n
Source:R/ci_p_coverage.R
ci_p_coverage_plot.RdThis function plots the coverage for any confidence interval for p.
ci_p_coverage_plot(
  n,
  conf.level = 0.95,
  intervalType = "wald",
  plot = TRUE,
  seq_p = seq(from = 0.01, to = 0.99, length.out = 50),
  col = "deepskyblue2",
  linecolor = "tomato",
  ...
)
Arguments
- n
number of trials.
- conf.level
nominal confidence level for the returned confidence interval. By default is 0.95.
- intervalType
type of confidence interval, possible choices are listed in ci_p.
- plot
logical value to obtain the plot, TRUE by default.
- seq_p
sequence for the values of \(n\). By default is
seq(from=0.01, to=0.99, length.out=50).- col
color for the coverage curve.
- linecolor
color for the line representing the conf.level.
- ...
further arguments and graphical parameters passed to plot function.
Value
A dataframe with Method, n, p and true coverage and the plot.
Details
This function was inspired by the binomTestCoveragePlot() function from conf package and Park & Leemis (2019).
References
Park, H., & Leemis, L. M. (2019). Ensemble confidence intervals for binomial proportions. Statistics in Medicine, 38(18), 3460-3475.
See also
ci_p.
Examples
ci_p_coverage_plot(n=10,
intervalType="wald",
conf.level=0.95,
ylim=c(0.8, 1), las=1)
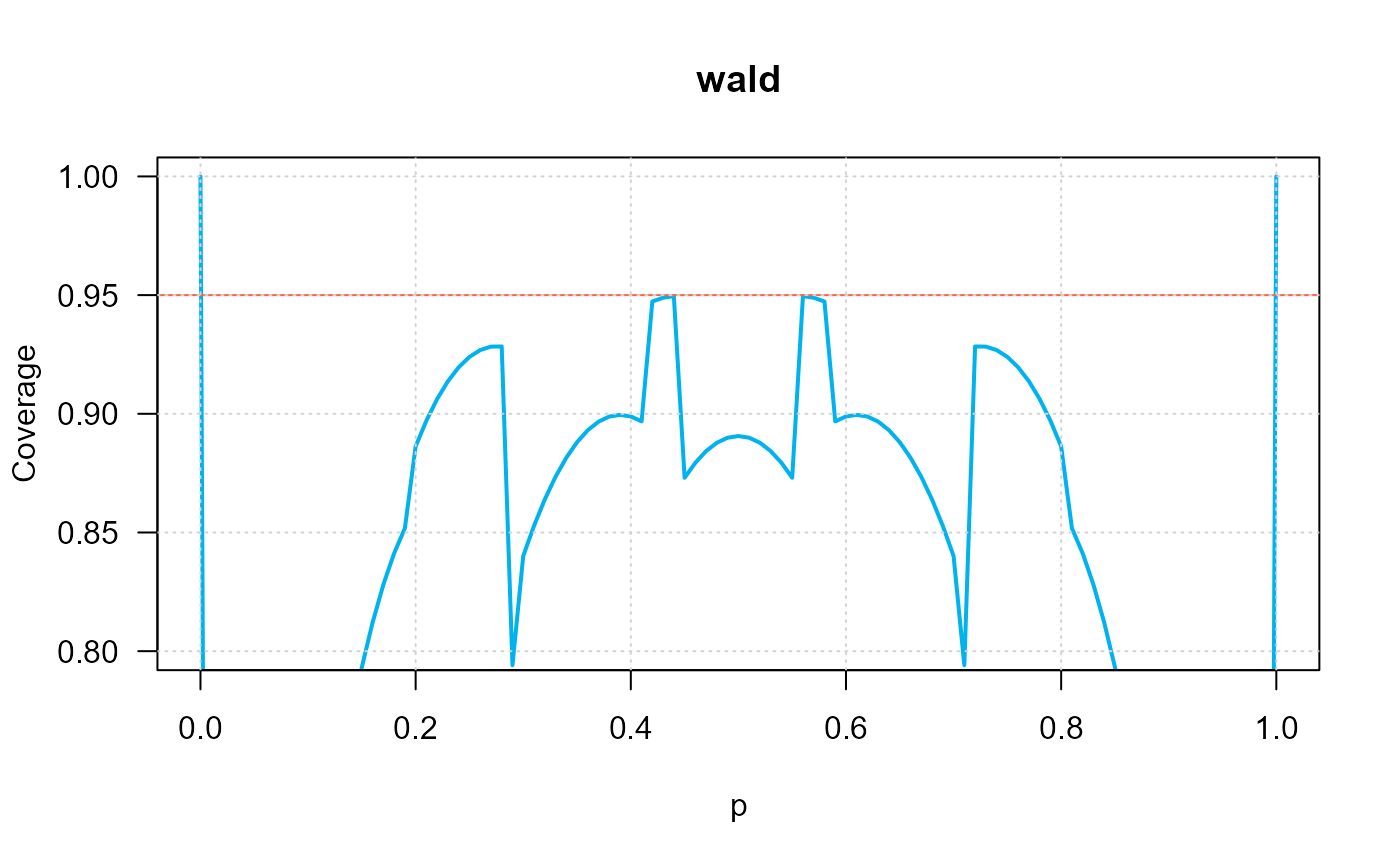 #> intervalType n p coverage
#> 1 ci_p_wald 10 0.01 0.09550408
#> 2 ci_p_wald 10 0.03 0.2624288
#> 3 ci_p_wald 10 0.05 0.4002346
#> 4 ci_p_wald 10 0.07 0.5124416
#> 5 ci_p_wald 10 0.09 0.6017501
#> 6 ci_p_wald 10 0.11 0.6856658
#> 7 ci_p_wald 10 0.13 0.7462799
#> 8 ci_p_wald 10 0.15 0.7932515
#> 9 ci_p_wald 10 0.17 0.8280358
#> 10 ci_p_wald 10 0.19 0.8517909
#> 11 ci_p_wald 10 0.21 0.8971237
#> 12 ci_p_wald 10 0.23 0.9137165
#> 13 ci_p_wald 10 0.25 0.9239588
#> 14 ci_p_wald 10 0.27 0.9283013
#> 15 ci_p_wald 10 0.29 0.7940937
#> 16 ci_p_wald 10 0.31 0.8527729
#> 17 ci_p_wald 10 0.33 0.8734411
#> 18 ci_p_wald 10 0.35 0.8880213
#> 19 ci_p_wald 10 0.37 0.8966804
#> 20 ci_p_wald 10 0.39 0.8995645
#> 21 ci_p_wald 10 0.41 0.8967987
#> 22 ci_p_wald 10 0.43 0.9488988
#> 23 ci_p_wald 10 0.45 0.8730485
#> 24 ci_p_wald 10 0.47 0.884297
#> 25 ci_p_wald 10 0.49 0.8899219
#> 26 ci_p_wald 10 0.51 0.8899219
#> 27 ci_p_wald 10 0.53 0.884297
#> 28 ci_p_wald 10 0.55 0.8730485
#> 29 ci_p_wald 10 0.57 0.9488988
#> 30 ci_p_wald 10 0.59 0.8967987
#> 31 ci_p_wald 10 0.61 0.8995645
#> 32 ci_p_wald 10 0.63 0.8966804
#> 33 ci_p_wald 10 0.65 0.8880213
#> 34 ci_p_wald 10 0.67 0.8734411
#> 35 ci_p_wald 10 0.69 0.8527729
#> 36 ci_p_wald 10 0.71 0.7940937
#> 37 ci_p_wald 10 0.73 0.9283013
#> 38 ci_p_wald 10 0.75 0.9239588
#> 39 ci_p_wald 10 0.77 0.9137165
#> 40 ci_p_wald 10 0.79 0.8971237
#> 41 ci_p_wald 10 0.81 0.8517909
#> 42 ci_p_wald 10 0.83 0.8280358
#> 43 ci_p_wald 10 0.85 0.7932515
#> 44 ci_p_wald 10 0.87 0.7462799
#> 45 ci_p_wald 10 0.89 0.6856658
#> 46 ci_p_wald 10 0.91 0.6017501
#> 47 ci_p_wald 10 0.93 0.5124416
#> 48 ci_p_wald 10 0.95 0.4002346
#> 49 ci_p_wald 10 0.97 0.2624288
#> 50 ci_p_wald 10 0.99 0.09550408
ci_p_coverage_plot(n=10,
intervalType="clopper_pearson",
conf.level=0.95,
ylim=c(0.9, 1), las=1)
 #> intervalType n p coverage
#> 1 ci_p_clopper_pearson 10 0.01 0.9957338
#> 2 ci_p_clopper_pearson 10 0.03 0.9972351
#> 3 ci_p_clopper_pearson 10 0.05 0.9884964
#> 4 ci_p_clopper_pearson 10 0.07 0.9964239
#> 5 ci_p_clopper_pearson 10 0.09 0.9911662
#> 6 ci_p_clopper_pearson 10 0.11 0.9822028
#> 7 ci_p_clopper_pearson 10 0.13 0.9947033
#> 8 ci_p_clopper_pearson 10 0.15 0.9901259
#> 9 ci_p_clopper_pearson 10 0.17 0.9831962
#> 10 ci_p_clopper_pearson 10 0.19 0.9951243
#> 11 ci_p_clopper_pearson 10 0.21 0.9918065
#> 12 ci_p_clopper_pearson 10 0.23 0.9869833
#> 13 ci_p_clopper_pearson 10 0.25 0.9802723
#> 14 ci_p_clopper_pearson 10 0.27 0.9943819
#> 15 ci_p_clopper_pearson 10 0.29 0.9913493
#> 16 ci_p_clopper_pearson 10 0.31 0.9626744
#> 17 ci_p_clopper_pearson 10 0.33 0.9632227
#> 18 ci_p_clopper_pearson 10 0.35 0.981716
#> 19 ci_p_clopper_pearson 10 0.37 0.9830104
#> 20 ci_p_clopper_pearson 10 0.39 0.9825503
#> 21 ci_p_clopper_pearson 10 0.41 0.9803151
#> 22 ci_p_clopper_pearson 10 0.43 0.97621
#> 23 ci_p_clopper_pearson 10 0.45 0.9722406
#> 24 ci_p_clopper_pearson 10 0.47 0.9762849
#> 25 ci_p_clopper_pearson 10 0.49 0.9782693
#> 26 ci_p_clopper_pearson 10 0.51 0.9782693
#> 27 ci_p_clopper_pearson 10 0.53 0.9762849
#> 28 ci_p_clopper_pearson 10 0.55 0.9722406
#> 29 ci_p_clopper_pearson 10 0.57 0.97621
#> 30 ci_p_clopper_pearson 10 0.59 0.9803151
#> 31 ci_p_clopper_pearson 10 0.61 0.9825503
#> 32 ci_p_clopper_pearson 10 0.63 0.9830104
#> 33 ci_p_clopper_pearson 10 0.65 0.981716
#> 34 ci_p_clopper_pearson 10 0.67 0.9632227
#> 35 ci_p_clopper_pearson 10 0.69 0.9626744
#> 36 ci_p_clopper_pearson 10 0.71 0.9913493
#> 37 ci_p_clopper_pearson 10 0.73 0.9943819
#> 38 ci_p_clopper_pearson 10 0.75 0.9802723
#> 39 ci_p_clopper_pearson 10 0.77 0.9869833
#> 40 ci_p_clopper_pearson 10 0.79 0.9918065
#> 41 ci_p_clopper_pearson 10 0.81 0.9951243
#> 42 ci_p_clopper_pearson 10 0.83 0.9831962
#> 43 ci_p_clopper_pearson 10 0.85 0.9901259
#> 44 ci_p_clopper_pearson 10 0.87 0.9947033
#> 45 ci_p_clopper_pearson 10 0.89 0.9822028
#> 46 ci_p_clopper_pearson 10 0.91 0.9911662
#> 47 ci_p_clopper_pearson 10 0.93 0.9964239
#> 48 ci_p_clopper_pearson 10 0.95 0.9884964
#> 49 ci_p_clopper_pearson 10 0.97 0.9972351
#> 50 ci_p_clopper_pearson 10 0.99 0.9957338
ci_p_coverage_plot(n=10,
intervalType="wilson",
conf.level=0.95,
ylim=c(0.9, 1), las=1)
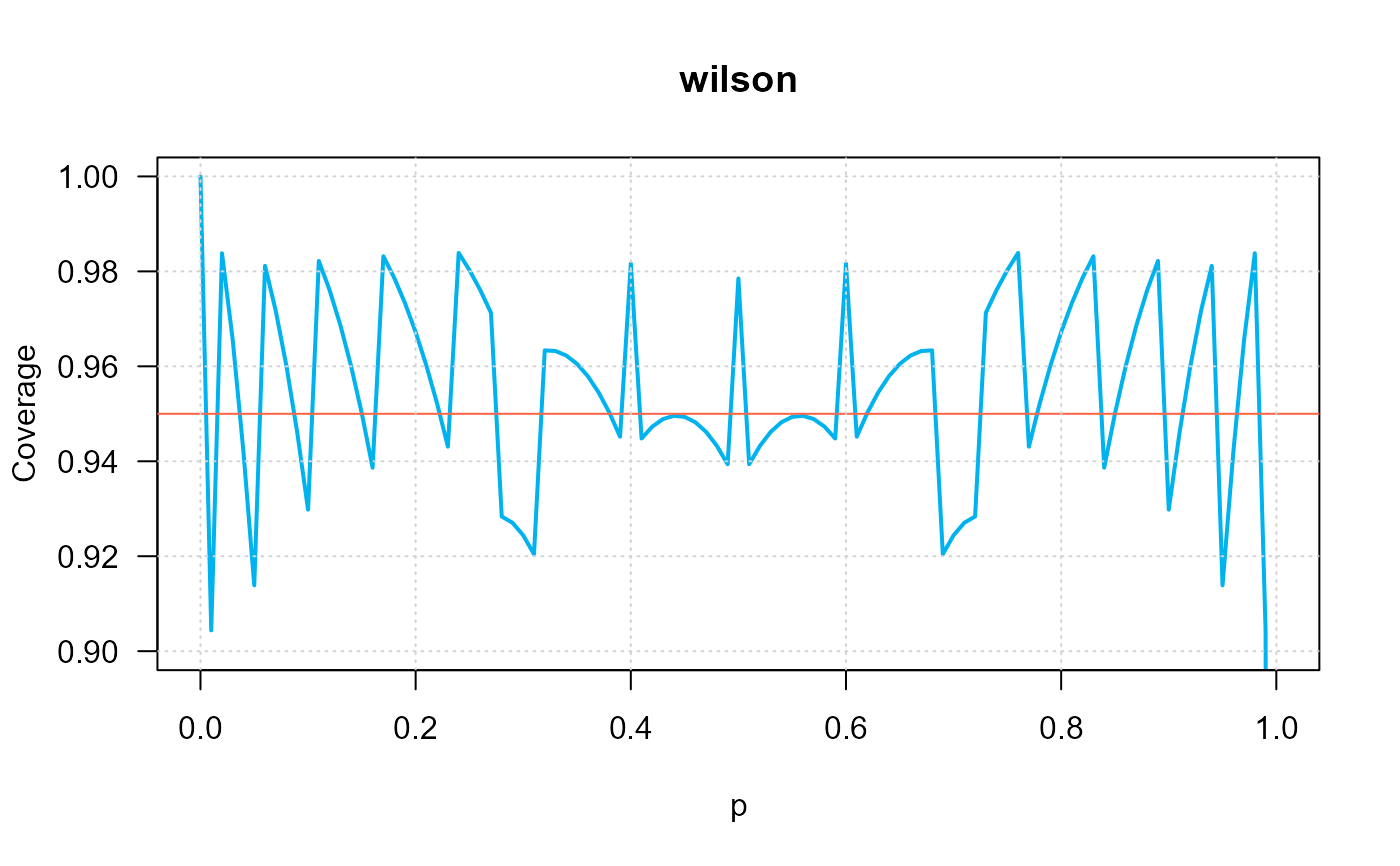 #> intervalType n p coverage
#> 1 ci_p_wilson 10 0.01 0.9043821
#> 2 ci_p_wilson 10 0.03 0.9654934
#> 3 ci_p_wilson 10 0.05 0.9138616
#> 4 ci_p_wilson 10 0.07 0.9716579
#> 5 ci_p_wilson 10 0.09 0.94596
#> 6 ci_p_wilson 10 0.11 0.9822028
#> 7 ci_p_wilson 10 0.13 0.9686952
#> 8 ci_p_wilson 10 0.15 0.9500302
#> 9 ci_p_wilson 10 0.17 0.9831962
#> 10 ci_p_wilson 10 0.19 0.9733675
#> 11 ci_p_wilson 10 0.21 0.9601376
#> 12 ci_p_wilson 10 0.23 0.9430804
#> 13 ci_p_wilson 10 0.25 0.9802723
#> 14 ci_p_wilson 10 0.27 0.9712776
#> 15 ci_p_wilson 10 0.29 0.9270544
#> 16 ci_p_wilson 10 0.31 0.9204284
#> 17 ci_p_wilson 10 0.33 0.9632227
#> 18 ci_p_wilson 10 0.35 0.960513
#> 19 ci_p_wilson 10 0.37 0.9545255
#> 20 ci_p_wilson 10 0.39 0.9451717
#> 21 ci_p_wilson 10 0.41 0.9447968
#> 22 ci_p_wilson 10 0.43 0.9488988
#> 23 ci_p_wilson 10 0.45 0.9493511
#> 24 ci_p_wilson 10 0.47 0.9461862
#> 25 ci_p_wilson 10 0.49 0.9393719
#> 26 ci_p_wilson 10 0.51 0.9393719
#> 27 ci_p_wilson 10 0.53 0.9461862
#> 28 ci_p_wilson 10 0.55 0.9493511
#> 29 ci_p_wilson 10 0.57 0.9488988
#> 30 ci_p_wilson 10 0.59 0.9447968
#> 31 ci_p_wilson 10 0.61 0.9451717
#> 32 ci_p_wilson 10 0.63 0.9545255
#> 33 ci_p_wilson 10 0.65 0.960513
#> 34 ci_p_wilson 10 0.67 0.9632227
#> 35 ci_p_wilson 10 0.69 0.9204284
#> 36 ci_p_wilson 10 0.71 0.9270544
#> 37 ci_p_wilson 10 0.73 0.9712776
#> 38 ci_p_wilson 10 0.75 0.9802723
#> 39 ci_p_wilson 10 0.77 0.9430804
#> 40 ci_p_wilson 10 0.79 0.9601376
#> 41 ci_p_wilson 10 0.81 0.9733675
#> 42 ci_p_wilson 10 0.83 0.9831962
#> 43 ci_p_wilson 10 0.85 0.9500302
#> 44 ci_p_wilson 10 0.87 0.9686952
#> 45 ci_p_wilson 10 0.89 0.9822028
#> 46 ci_p_wilson 10 0.91 0.94596
#> 47 ci_p_wilson 10 0.93 0.9716579
#> 48 ci_p_wilson 10 0.95 0.9138616
#> 49 ci_p_wilson 10 0.97 0.9654934
#> 50 ci_p_wilson 10 0.99 0.9043821
ci_p_coverage_plot(n=10,
intervalType="jeffreys",
conf.level=0.95,
ylim=c(0.9, 1), las=1)
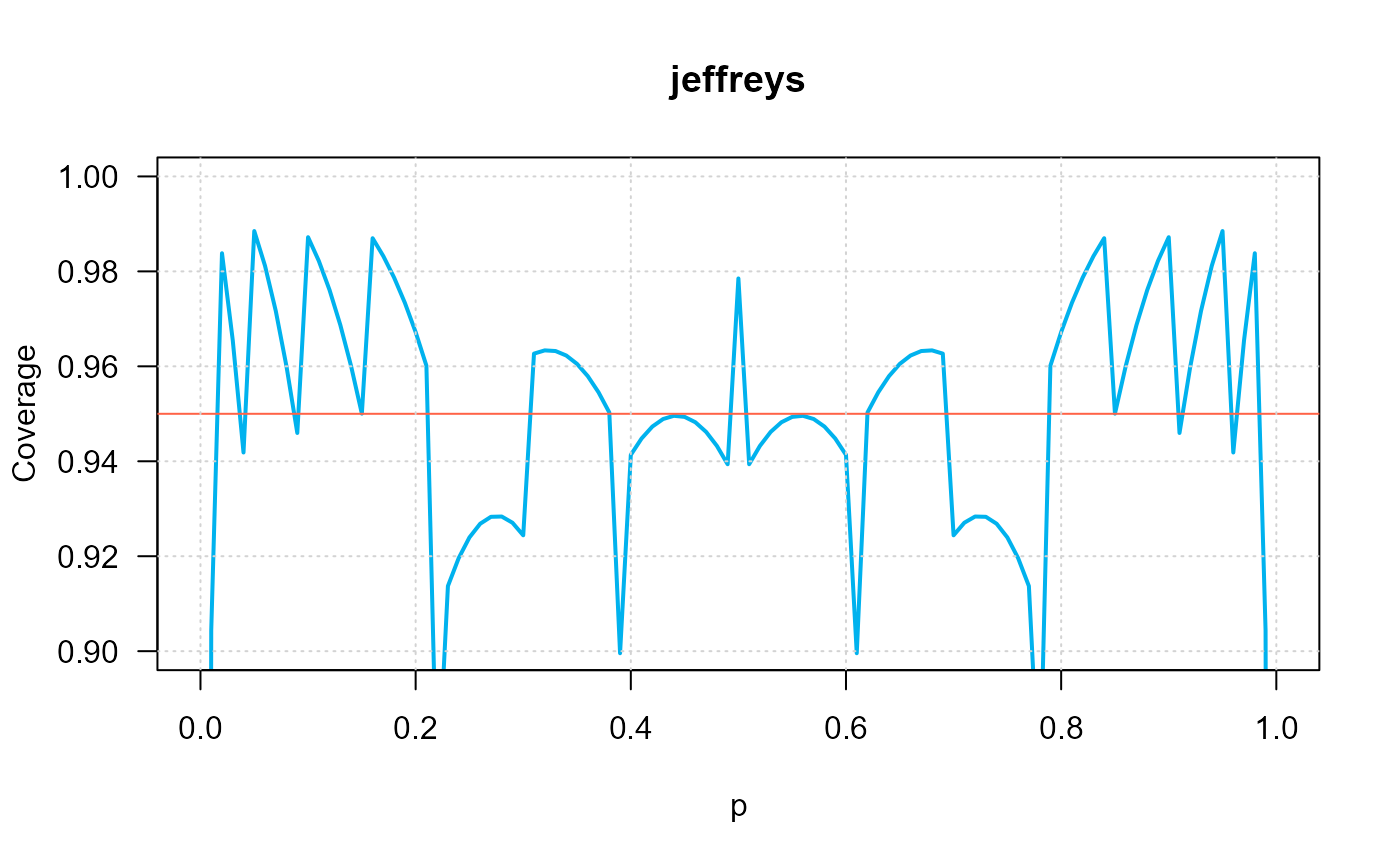 #> intervalType n p coverage
#> 1 ci_p_jeffreys 10 0.01 0.9043821
#> 2 ci_p_jeffreys 10 0.03 0.9654934
#> 3 ci_p_jeffreys 10 0.05 0.9884964
#> 4 ci_p_jeffreys 10 0.07 0.9716579
#> 5 ci_p_jeffreys 10 0.09 0.94596
#> 6 ci_p_jeffreys 10 0.11 0.9822028
#> 7 ci_p_jeffreys 10 0.13 0.9686952
#> 8 ci_p_jeffreys 10 0.15 0.9500302
#> 9 ci_p_jeffreys 10 0.17 0.9831962
#> 10 ci_p_jeffreys 10 0.19 0.9733675
#> 11 ci_p_jeffreys 10 0.21 0.9601376
#> 12 ci_p_jeffreys 10 0.23 0.9137165
#> 13 ci_p_jeffreys 10 0.25 0.9239588
#> 14 ci_p_jeffreys 10 0.27 0.9283013
#> 15 ci_p_jeffreys 10 0.29 0.9270544
#> 16 ci_p_jeffreys 10 0.31 0.9626744
#> 17 ci_p_jeffreys 10 0.33 0.9632227
#> 18 ci_p_jeffreys 10 0.35 0.960513
#> 19 ci_p_jeffreys 10 0.37 0.9545255
#> 20 ci_p_jeffreys 10 0.39 0.8995645
#> 21 ci_p_jeffreys 10 0.41 0.9447968
#> 22 ci_p_jeffreys 10 0.43 0.9488988
#> 23 ci_p_jeffreys 10 0.45 0.9493511
#> 24 ci_p_jeffreys 10 0.47 0.9461862
#> 25 ci_p_jeffreys 10 0.49 0.9393719
#> 26 ci_p_jeffreys 10 0.51 0.9393719
#> 27 ci_p_jeffreys 10 0.53 0.9461862
#> 28 ci_p_jeffreys 10 0.55 0.9493511
#> 29 ci_p_jeffreys 10 0.57 0.9488988
#> 30 ci_p_jeffreys 10 0.59 0.9447968
#> 31 ci_p_jeffreys 10 0.61 0.8995645
#> 32 ci_p_jeffreys 10 0.63 0.9545255
#> 33 ci_p_jeffreys 10 0.65 0.960513
#> 34 ci_p_jeffreys 10 0.67 0.9632227
#> 35 ci_p_jeffreys 10 0.69 0.9626744
#> 36 ci_p_jeffreys 10 0.71 0.9270544
#> 37 ci_p_jeffreys 10 0.73 0.9283013
#> 38 ci_p_jeffreys 10 0.75 0.9239588
#> 39 ci_p_jeffreys 10 0.77 0.9137165
#> 40 ci_p_jeffreys 10 0.79 0.9601376
#> 41 ci_p_jeffreys 10 0.81 0.9733675
#> 42 ci_p_jeffreys 10 0.83 0.9831962
#> 43 ci_p_jeffreys 10 0.85 0.9500302
#> 44 ci_p_jeffreys 10 0.87 0.9686952
#> 45 ci_p_jeffreys 10 0.89 0.9822028
#> 46 ci_p_jeffreys 10 0.91 0.94596
#> 47 ci_p_jeffreys 10 0.93 0.9716579
#> 48 ci_p_jeffreys 10 0.95 0.9884964
#> 49 ci_p_jeffreys 10 0.97 0.9654934
#> 50 ci_p_jeffreys 10 0.99 0.9043821
ci_p_coverage_plot(n=10,
intervalType="agresti_coull",
conf.level=0.95,
ylim=c(0.9, 1), las=1)
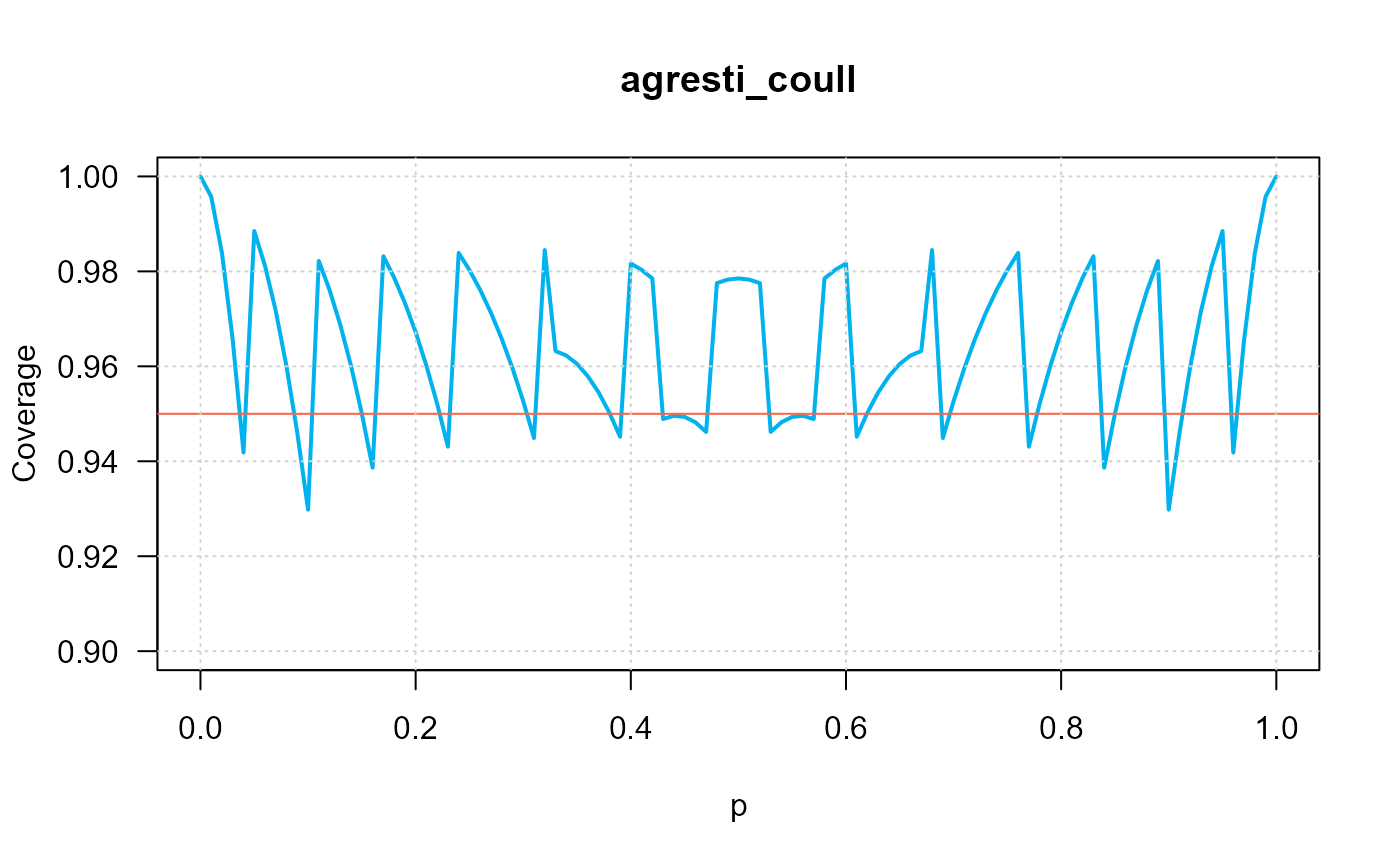 #> intervalType n p coverage
#> 1 ci_p_agresti_coull 10 0.01 0.9957338
#> 2 ci_p_agresti_coull 10 0.03 0.9654934
#> 3 ci_p_agresti_coull 10 0.05 0.9884964
#> 4 ci_p_agresti_coull 10 0.07 0.9716579
#> 5 ci_p_agresti_coull 10 0.09 0.94596
#> 6 ci_p_agresti_coull 10 0.11 0.9822028
#> 7 ci_p_agresti_coull 10 0.13 0.9686952
#> 8 ci_p_agresti_coull 10 0.15 0.9500302
#> 9 ci_p_agresti_coull 10 0.17 0.9831962
#> 10 ci_p_agresti_coull 10 0.19 0.9733675
#> 11 ci_p_agresti_coull 10 0.21 0.9601376
#> 12 ci_p_agresti_coull 10 0.23 0.9430804
#> 13 ci_p_agresti_coull 10 0.25 0.9802723
#> 14 ci_p_agresti_coull 10 0.27 0.9712776
#> 15 ci_p_agresti_coull 10 0.29 0.9596068
#> 16 ci_p_agresti_coull 10 0.31 0.9448903
#> 17 ci_p_agresti_coull 10 0.33 0.9632227
#> 18 ci_p_agresti_coull 10 0.35 0.960513
#> 19 ci_p_agresti_coull 10 0.37 0.9545255
#> 20 ci_p_agresti_coull 10 0.39 0.9451717
#> 21 ci_p_agresti_coull 10 0.41 0.9803151
#> 22 ci_p_agresti_coull 10 0.43 0.9488988
#> 23 ci_p_agresti_coull 10 0.45 0.9493511
#> 24 ci_p_agresti_coull 10 0.47 0.9461862
#> 25 ci_p_agresti_coull 10 0.49 0.9782693
#> 26 ci_p_agresti_coull 10 0.51 0.9782693
#> 27 ci_p_agresti_coull 10 0.53 0.9461862
#> 28 ci_p_agresti_coull 10 0.55 0.9493511
#> 29 ci_p_agresti_coull 10 0.57 0.9488988
#> 30 ci_p_agresti_coull 10 0.59 0.9803151
#> 31 ci_p_agresti_coull 10 0.61 0.9451717
#> 32 ci_p_agresti_coull 10 0.63 0.9545255
#> 33 ci_p_agresti_coull 10 0.65 0.960513
#> 34 ci_p_agresti_coull 10 0.67 0.9632227
#> 35 ci_p_agresti_coull 10 0.69 0.9448903
#> 36 ci_p_agresti_coull 10 0.71 0.9596068
#> 37 ci_p_agresti_coull 10 0.73 0.9712776
#> 38 ci_p_agresti_coull 10 0.75 0.9802723
#> 39 ci_p_agresti_coull 10 0.77 0.9430804
#> 40 ci_p_agresti_coull 10 0.79 0.9601376
#> 41 ci_p_agresti_coull 10 0.81 0.9733675
#> 42 ci_p_agresti_coull 10 0.83 0.9831962
#> 43 ci_p_agresti_coull 10 0.85 0.9500302
#> 44 ci_p_agresti_coull 10 0.87 0.9686952
#> 45 ci_p_agresti_coull 10 0.89 0.9822028
#> 46 ci_p_agresti_coull 10 0.91 0.94596
#> 47 ci_p_agresti_coull 10 0.93 0.9716579
#> 48 ci_p_agresti_coull 10 0.95 0.9884964
#> 49 ci_p_agresti_coull 10 0.97 0.9654934
#> 50 ci_p_agresti_coull 10 0.99 0.9957338
ci_p_coverage_plot(n=10,
intervalType="arcsine",
conf.level=0.95,
ylim=c(0.9, 1), las=1)
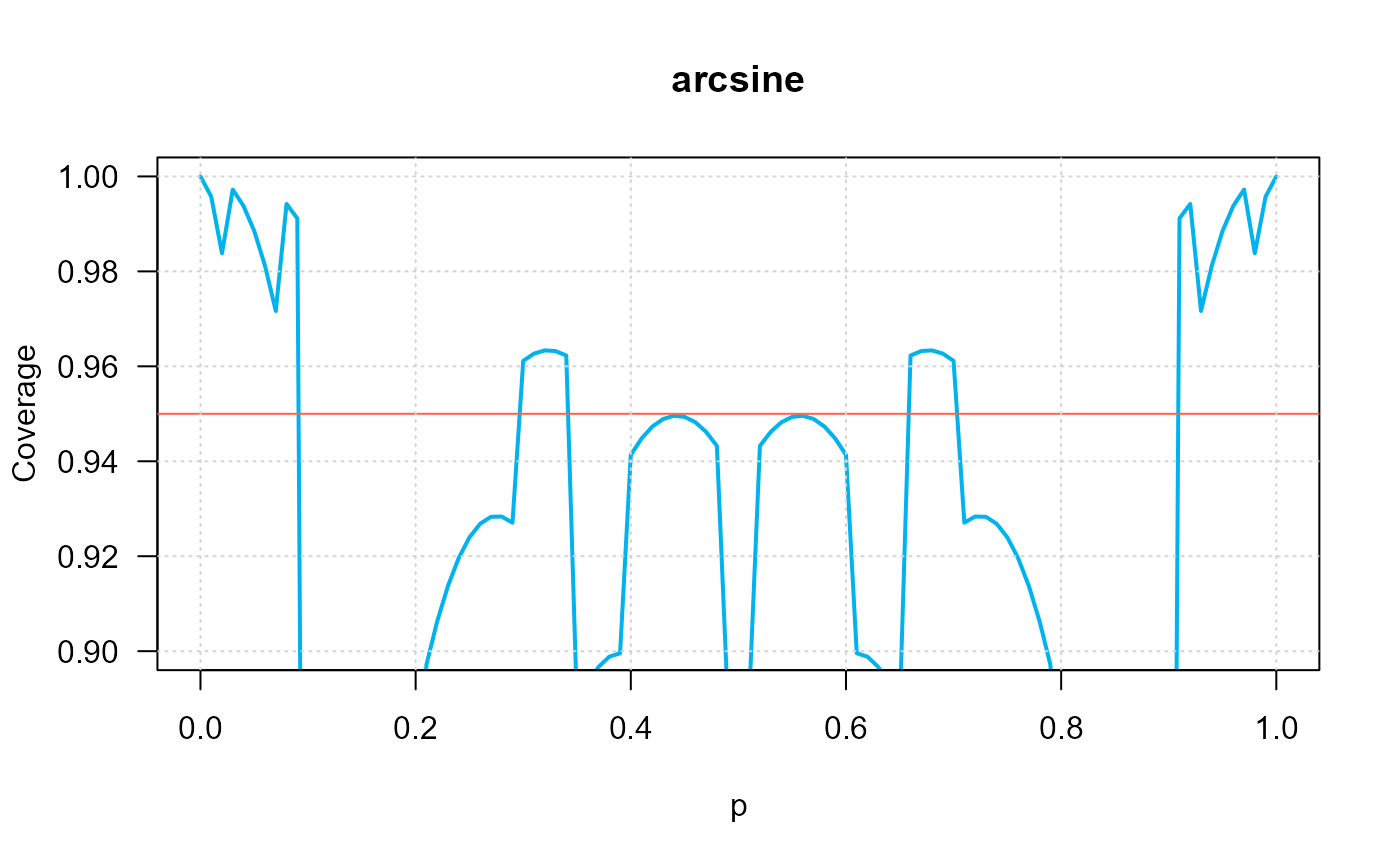 #> intervalType n p coverage
#> 1 ci_p_arcsine 10 0.01 0.9957338
#> 2 ci_p_arcsine 10 0.03 0.9972351
#> 3 ci_p_arcsine 10 0.05 0.9884964
#> 4 ci_p_arcsine 10 0.07 0.9716579
#> 5 ci_p_arcsine 10 0.09 0.9911662
#> 6 ci_p_arcsine 10 0.11 0.6703856
#> 7 ci_p_arcsine 10 0.13 0.7202718
#> 8 ci_p_arcsine 10 0.15 0.7932515
#> 9 ci_p_arcsine 10 0.17 0.8280358
#> 10 ci_p_arcsine 10 0.19 0.8517909
#> 11 ci_p_arcsine 10 0.21 0.8971237
#> 12 ci_p_arcsine 10 0.23 0.9137165
#> 13 ci_p_arcsine 10 0.25 0.9239588
#> 14 ci_p_arcsine 10 0.27 0.9283013
#> 15 ci_p_arcsine 10 0.29 0.9270544
#> 16 ci_p_arcsine 10 0.31 0.9626744
#> 17 ci_p_arcsine 10 0.33 0.9632227
#> 18 ci_p_arcsine 10 0.35 0.8880213
#> 19 ci_p_arcsine 10 0.37 0.8966804
#> 20 ci_p_arcsine 10 0.39 0.8995645
#> 21 ci_p_arcsine 10 0.41 0.9447968
#> 22 ci_p_arcsine 10 0.43 0.9488988
#> 23 ci_p_arcsine 10 0.45 0.9493511
#> 24 ci_p_arcsine 10 0.47 0.9461862
#> 25 ci_p_arcsine 10 0.49 0.8899219
#> 26 ci_p_arcsine 10 0.51 0.8899219
#> 27 ci_p_arcsine 10 0.53 0.9461862
#> 28 ci_p_arcsine 10 0.55 0.9493511
#> 29 ci_p_arcsine 10 0.57 0.9488988
#> 30 ci_p_arcsine 10 0.59 0.9447968
#> 31 ci_p_arcsine 10 0.61 0.8995645
#> 32 ci_p_arcsine 10 0.63 0.8966804
#> 33 ci_p_arcsine 10 0.65 0.8880213
#> 34 ci_p_arcsine 10 0.67 0.9632227
#> 35 ci_p_arcsine 10 0.69 0.9626744
#> 36 ci_p_arcsine 10 0.71 0.9270544
#> 37 ci_p_arcsine 10 0.73 0.9283013
#> 38 ci_p_arcsine 10 0.75 0.9239588
#> 39 ci_p_arcsine 10 0.77 0.9137165
#> 40 ci_p_arcsine 10 0.79 0.8971237
#> 41 ci_p_arcsine 10 0.81 0.8517909
#> 42 ci_p_arcsine 10 0.83 0.8280358
#> 43 ci_p_arcsine 10 0.85 0.7932515
#> 44 ci_p_arcsine 10 0.87 0.7202718
#> 45 ci_p_arcsine 10 0.89 0.6703856
#> 46 ci_p_arcsine 10 0.91 0.9911662
#> 47 ci_p_arcsine 10 0.93 0.9716579
#> 48 ci_p_arcsine 10 0.95 0.9884964
#> 49 ci_p_arcsine 10 0.97 0.9972351
#> 50 ci_p_arcsine 10 0.99 0.9957338