This function performs the mean test using raw data (vector).
z.test(x, sigma2, alternative = "two.sided", mu = 0, conf.level = 0.95)Arguments
- x
a (non-empty) numeric vector of data values.
- sigma2
population variance which is known.
- alternative
a character string specifying the alternative hypothesis, must be one of
two.sided(default),greaterorless. You can specify just the initial letter.- mu
the hypothesized number in the null hypothesis.
- conf.level
confidence level of the interval, by default its value is 0.95.
Value
A list with class htest containing the following
components:
- statistic
the value of the statistic.
- p.value
the p-value for the test.
- conf.int
a confidence interval for the variance.
- estimate
the estimated mean.
- null.value
the specified hypothesized value for alternative hypothesis.
- alternative
a character string describing the alternative hypothesis.
- method
a character string indicating the type of test performed.
- data.name
a character string giving the name of the data.
Examples
# Example 1
# H0: mu = 350
# Ha: mu < 350 with sigma2=25
content <- c(355, 353, 352, 346, 345, 345, 353, 353, 344, 350)
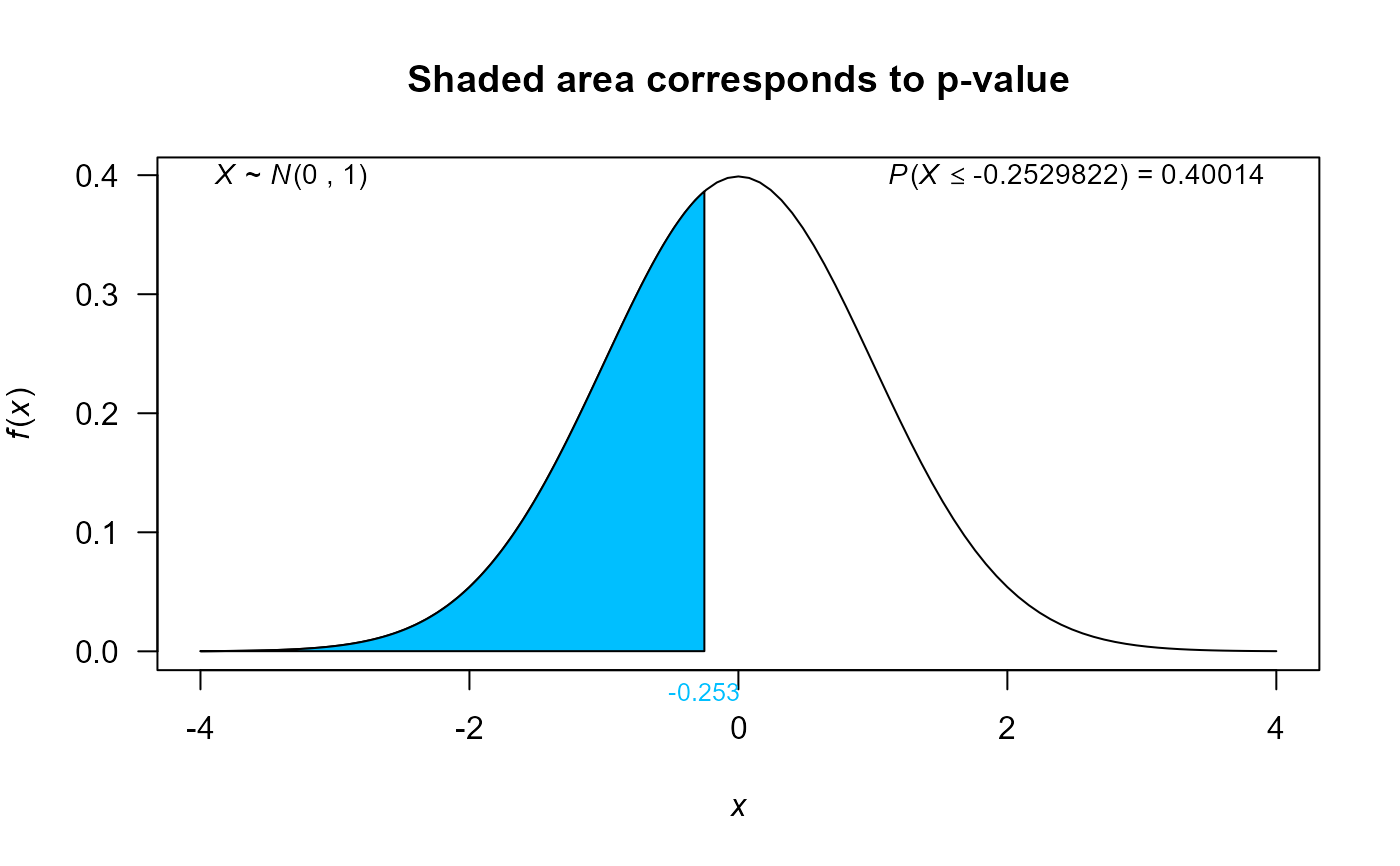
res1 <- z.test(x=content, mu=350, sigma2=25, alternative='less')
res1
#>
#> 	One Sample z-test
#>
#> data:  content
#> Z = -0.25298, p-value = 0.4001
#> alternative hypothesis: true mean is less than 350
#> 95 percent confidence interval:
#>      -Inf 352.2007
#> sample estimates:
#> mean of content
#>           349.6
#>
plot(res1, shade.col='deepskyblue', col='deepskyblue')


# Example 2
# H0: mu = 170
# Ha: mu != 170 with sigma2=25
x <- rnorm(n=80, mean=171, sd=5)
res2 <- z.test(x=x, mu=170, sigma2=25, alternative='two.sided')
res2
#>
#> 	One Sample z-test
#>
#> data:  x
#> Z = 1.1401, p-value = 0.2542
#> alternative hypothesis: true mean is not equal to 170
#> 95 percent confidence interval:
#>  169.5417 171.7330
#> sample estimates:
#> mean of x
#>  170.6374
#>
plot(res2, shade.col='indianred1', col='indianred1')
