This function plots shades for any CONTINUOUS probability distribution
shade.dist(
  dist = "dnorm",
  param = list(mean = 0, sd = 1),
  a = NULL,
  b = NULL,
  type = "lower",
  from,
  to,
  col.shadow = "skyblue",
  col.line = "black",
  lwd = 3,
  nbreaks = 1000,
  ylab = NULL,
  x,
  ...
)
Arguments
- dist
the distribution name as
'dnorm','dt','dbeta'or any pdf available in the current session. Remember, only for CONTINUOUS probability distribution.- param
is a list with the parameters of the distribution.
- a
is the lower limit of the shaded area.
- b
is the upper limit of the shaded area.
- type
is used to define the shaded area, it could be
'lower'(by default),'upper','middle'or'two'for two tails.- from
minimum X value to plot the density.
- to
maximum X value to plot the density.
- col.shadow
is the shade color, by default is
'skyblue'.- col.line
is the color line for the density.
- lwd
is the line width, a positive number, defaulting to 3.
- nbreaks
is the number of divisions to plot the shadow, by default is 10000.
- ylab
is the y label, by default is 'Density'.
- x
it is nothing.
- ...
Arguments to be passed to methods, such as graphical parameters (see par).
Examples
# With normal distribution
shade.dist(dist='dnorm', param=list(mean=0, sd=1),
a=0, b=1, type='middle', from=-3, to=3)
 shade.dist(dist='dnorm', param=list(mean=0, sd=1),
a=0, type='lower', from=-3, to=3)
shade.dist(dist='dnorm', param=list(mean=0, sd=1),
a=0, type='lower', from=-3, to=3)
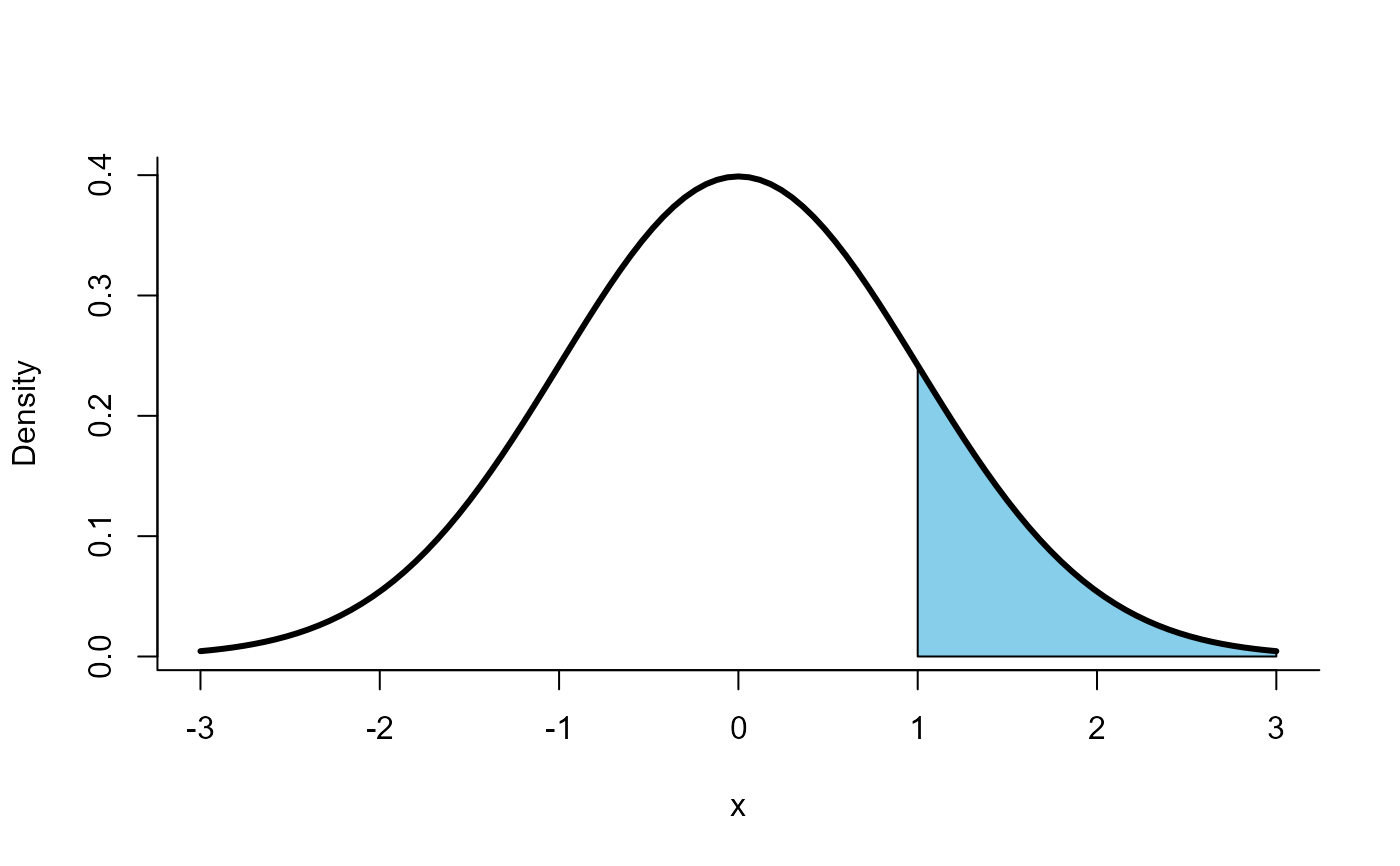
 shade.dist(dist='dnorm', param=list(mean=0, sd=1),
b=1, type='upper', from=-3, to=3)
shade.dist(dist='dnorm', param=list(mean=0, sd=1),
b=1, type='upper', from=-3, to=3)
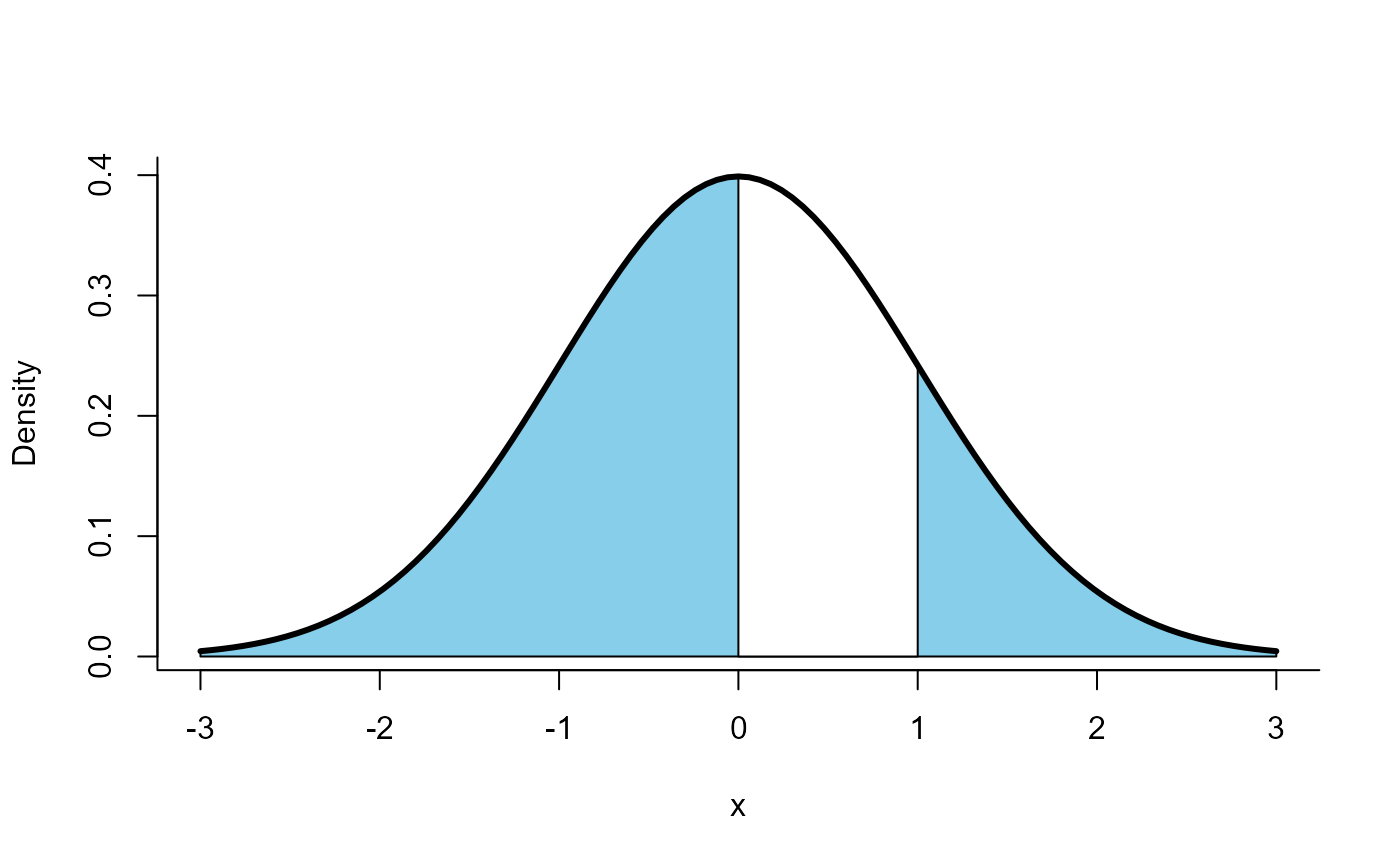
 shade.dist(dist='dnorm', param=list(mean=0, sd=1),
a=0, b=1, type='two', from=-3, to=3)
shade.dist(dist='dnorm', param=list(mean=0, sd=1),
a=0, b=1, type='two', from=-3, to=3)
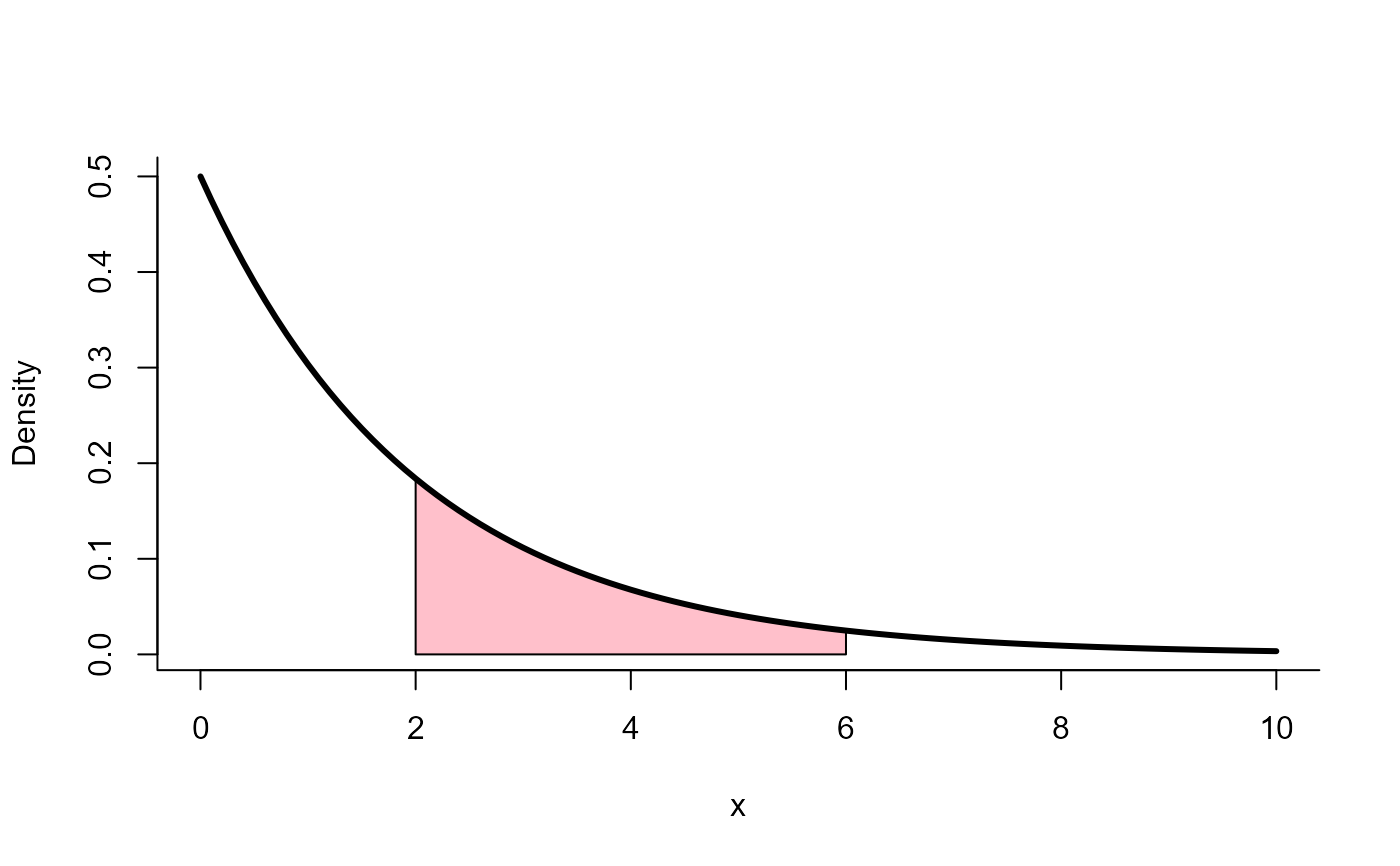
 # With chi-square distribution
shade.dist(dist='dchisq', param=list(df=2),
a=2, b=6, type='middle', from=0, to=10, col.shadow='pink')
# With chi-square distribution
shade.dist(dist='dchisq', param=list(df=2),
a=2, b=6, type='middle', from=0, to=10, col.shadow='pink')
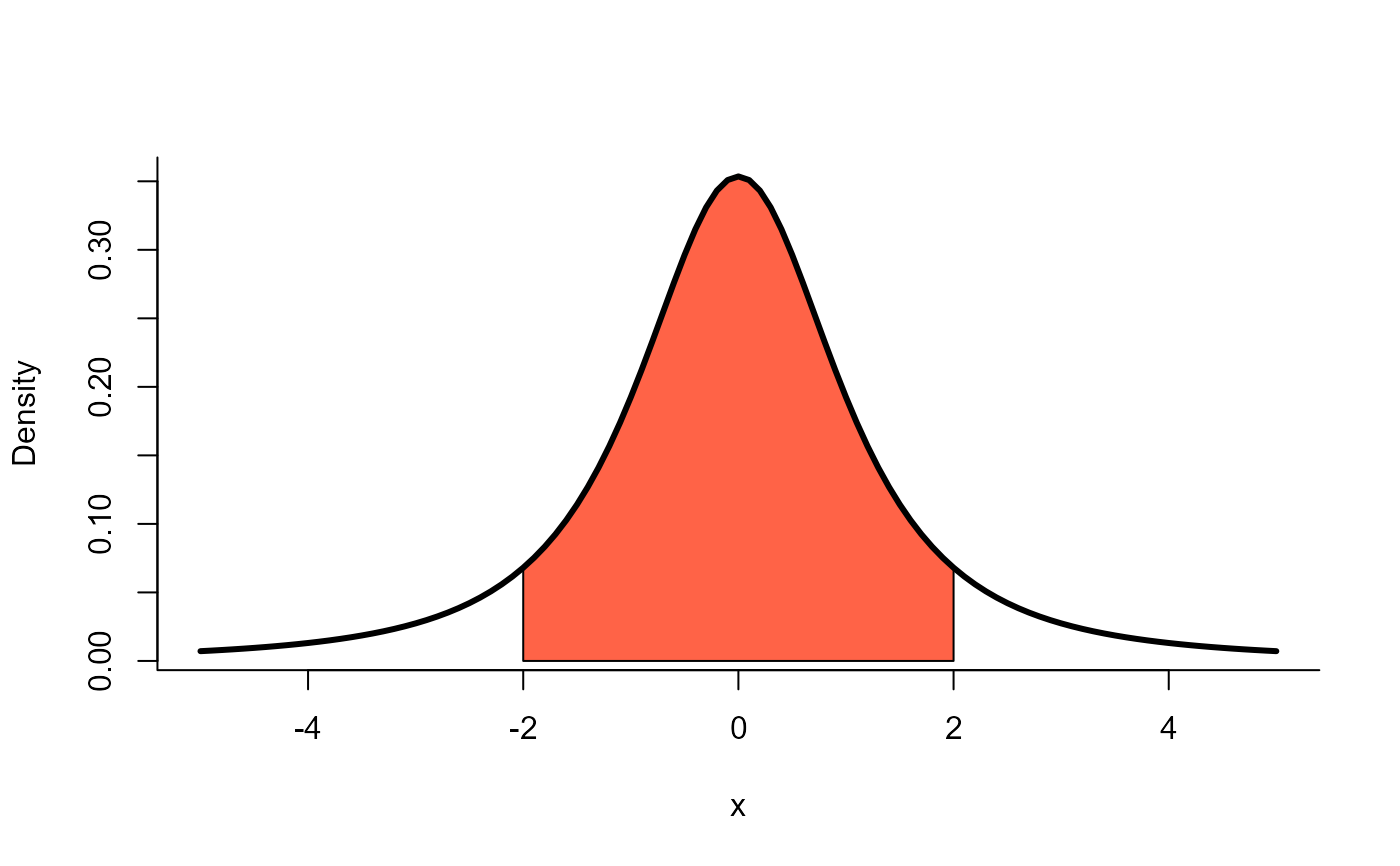
 # With t distribution
shade.dist(dist='dt', param=list(df=2),
a=-2, b=2, type='middle', from=-5, to=5, col.shadow='tomato')
# With t distribution
shade.dist(dist='dt', param=list(df=2),
a=-2, b=2, type='middle', from=-5, to=5, col.shadow='tomato')
 # With beta distribution
shade.dist(dist='dbeta', param=list(shape1=2, shape2=5),
a=0.2, b=0.6, type='middle', from=0, to=1,
nbreaks=3, main='nbreaks=3, opps!!!')
# With beta distribution
shade.dist(dist='dbeta', param=list(shape1=2, shape2=5),
a=0.2, b=0.6, type='middle', from=0, to=1,
nbreaks=3, main='nbreaks=3, opps!!!')
 shade.dist(dist='dbeta', param=list(shape1=2, shape2=5),
a=0.2, b=0.6, type='middle', from=0, to=1,
nbreaks=20)
shade.dist(dist='dbeta', param=list(shape1=2, shape2=5),
a=0.2, b=0.6, type='middle', from=0, to=1,
nbreaks=20)