Draw the CDF for a discrete random variable
plot_discrete_cdf(x, fx, col = "blue", lwd = 3, ...)
Arguments
- x
vector with the values of the random variable \(X\).
- fx
vector with the probabilities of \(X\).
- col
color for the line.
- lwd
line width.
- ...
further arguments and graphical parameters.
Value
A plot with the cumulative distribution function.
Examples
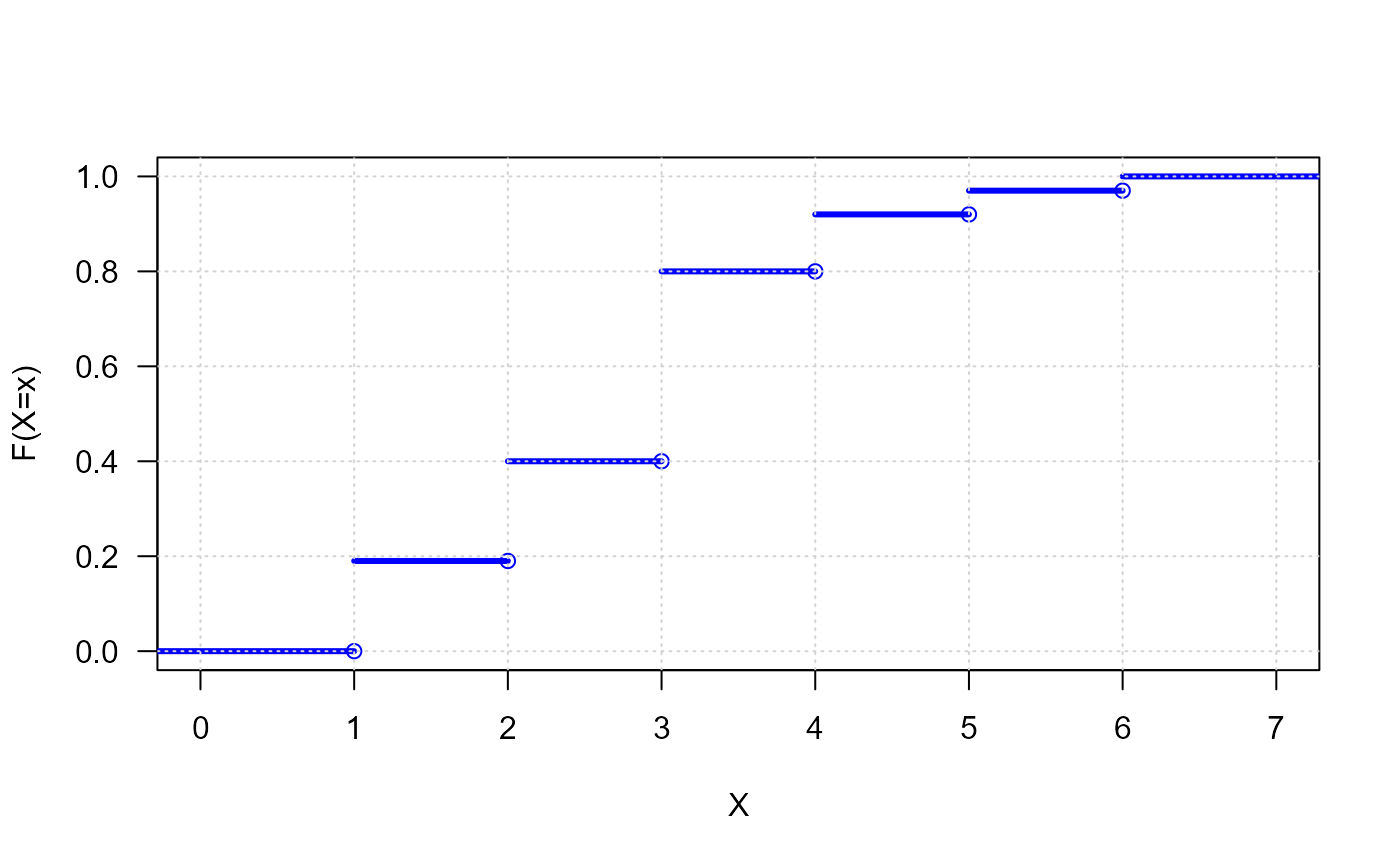
# Example 1
# for a particular distribution
x <- 1:6
fx <- c(0.19, 0.21, 0.4, 0.12, 0.05, 0.03)
plot_discrete_cdf(x, fx, las=1, main="")
 # Example 2
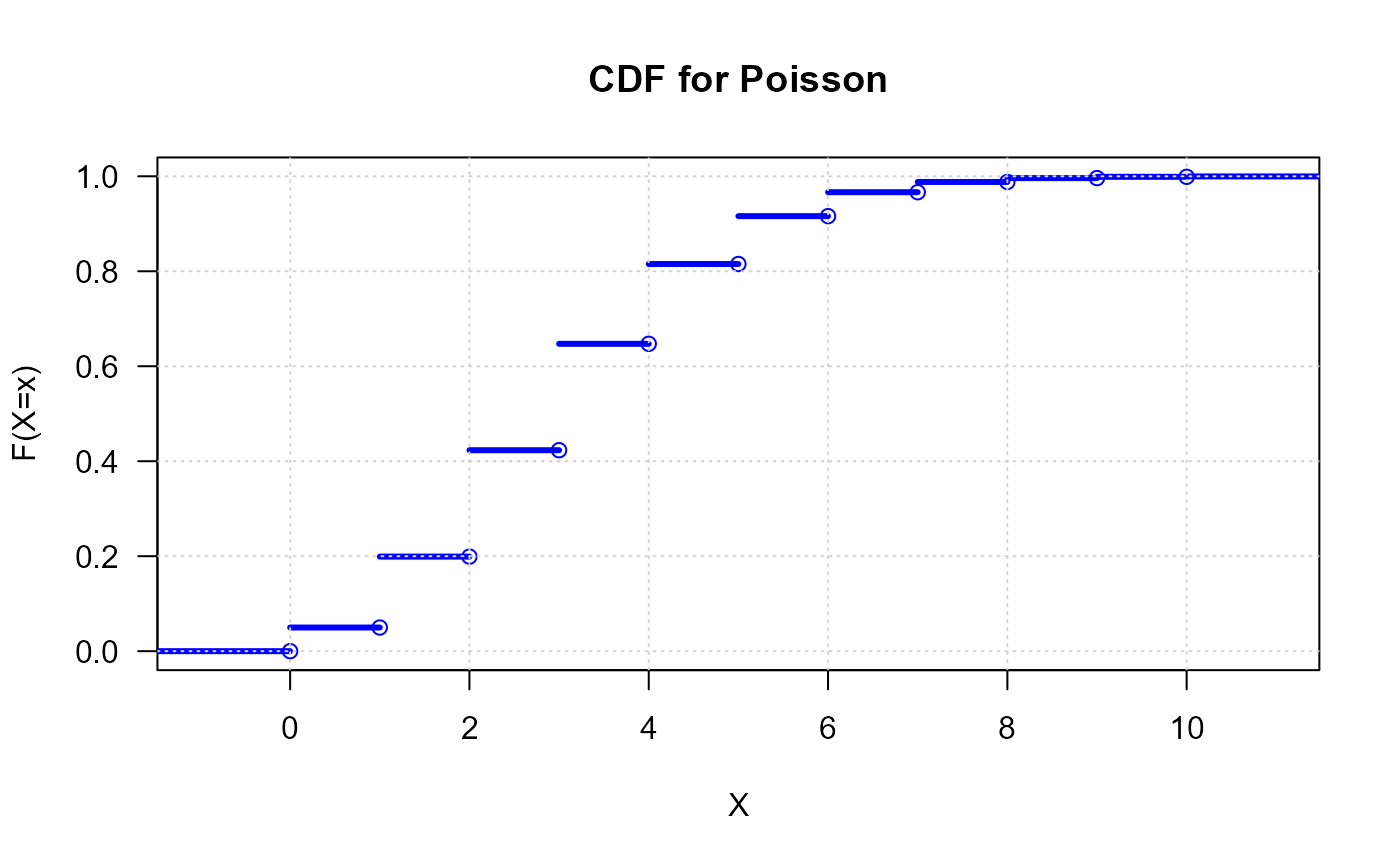
# for a Poisson distribution
x <- 0:10
fx <- dpois(x, lambda=3)
plot_discrete_cdf(x, fx, las=1,
main="CDF for Poisson")
# Example 2
# for a Poisson distribution
x <- 0:10
fx <- dpois(x, lambda=3)
plot_discrete_cdf(x, fx, las=1,
main="CDF for Poisson")