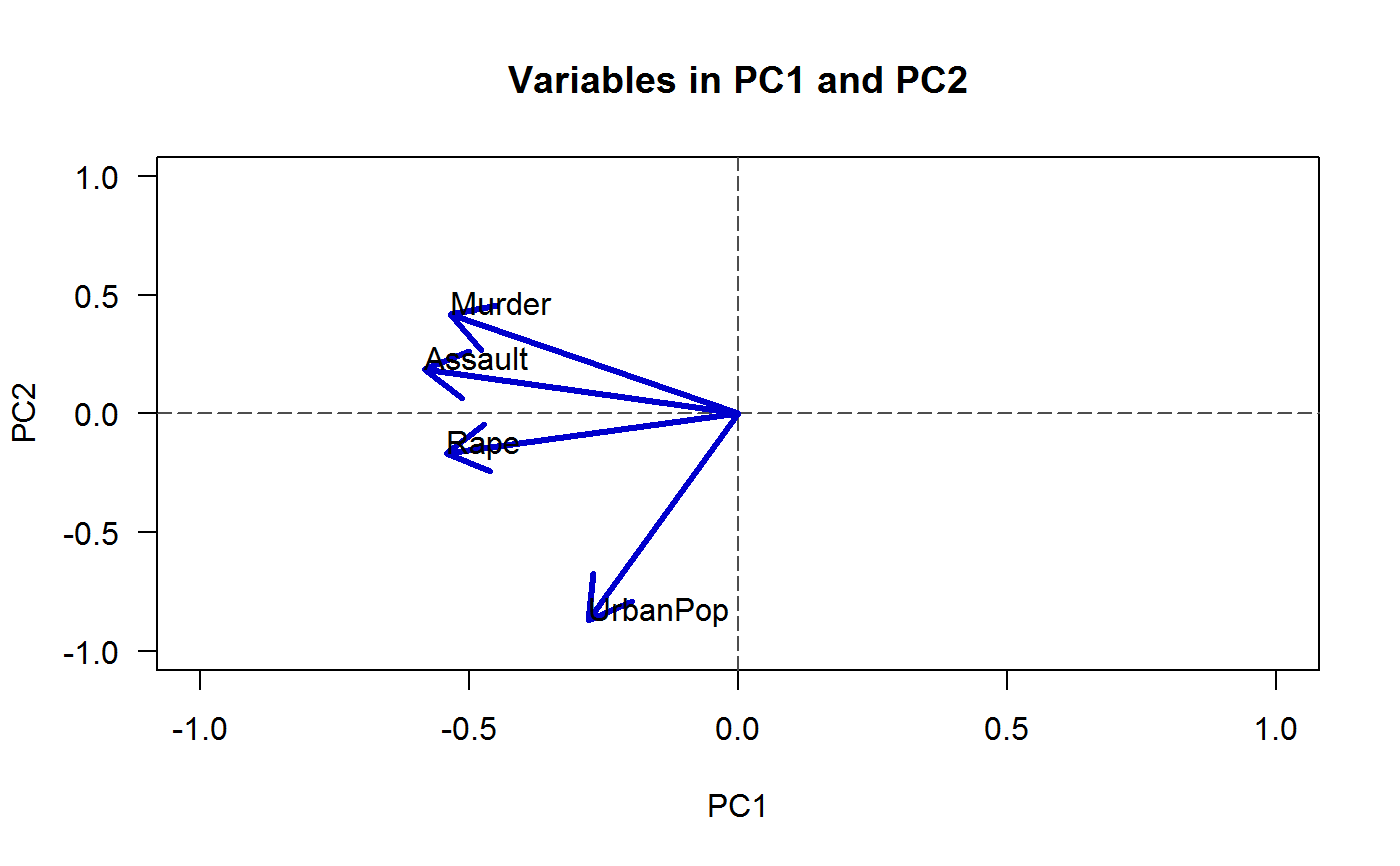
This function plots the variables in the coordinate plane PC1-PC2.
plot_var_pc(mod, col.arrow = "gray60", xlab = NULL, ylab = NULL, ...)
Arguments
| mod | A prcomp or princomp object. |
|---|---|
| col.arrow | color for the arrows. |
| xlab, ylab | labels for x axis and y axis. |
| ... | Arguments to be passed to methods, such as graphical parameters (see par). |
See also
[plot_obs_pc()].
Examples
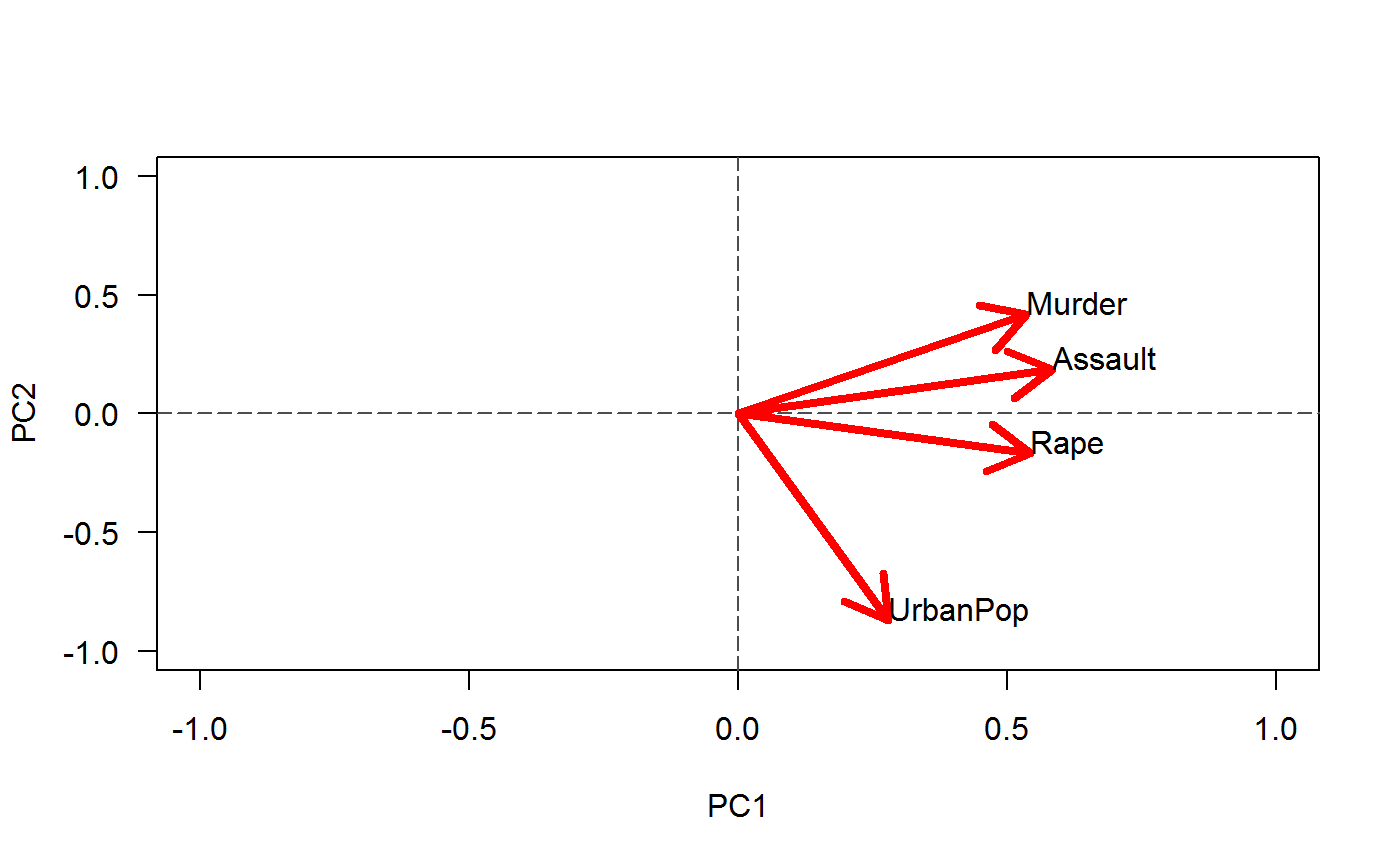
plot_var_pc(pca1, main='Variables in PC1 and PC2', col='blue3', lwd=3)# # For a princomp object pca2 <- princomp(x=USArrests, cor=TRUE) plot_var_pc(pca2, col='red', lwd=4)