This function gives the profile plot for contingency table objects created by table or xtabs or matrix.
plot_prof(x, Row = TRUE, cex.names = 0.5, xlab = "",
  ylab = "Frequency", cex = 1, ...)
Arguments
| x | A table, xtabs or matrix object. |
|---|---|
| Row | A logical value to indicate if profile plot is for Rows o Columns. |
| cex.names | Expansion factor for axis names (bar labels). |
| xlab | A label for the x axis. |
| ylab | A label for the y axis, by default is Frequency. |
| cex | Character expansion factor for legend. |
| ... | Other plotting parameters to affect the plot. |
Value
plot_prof function returns a profile plot.
Examples
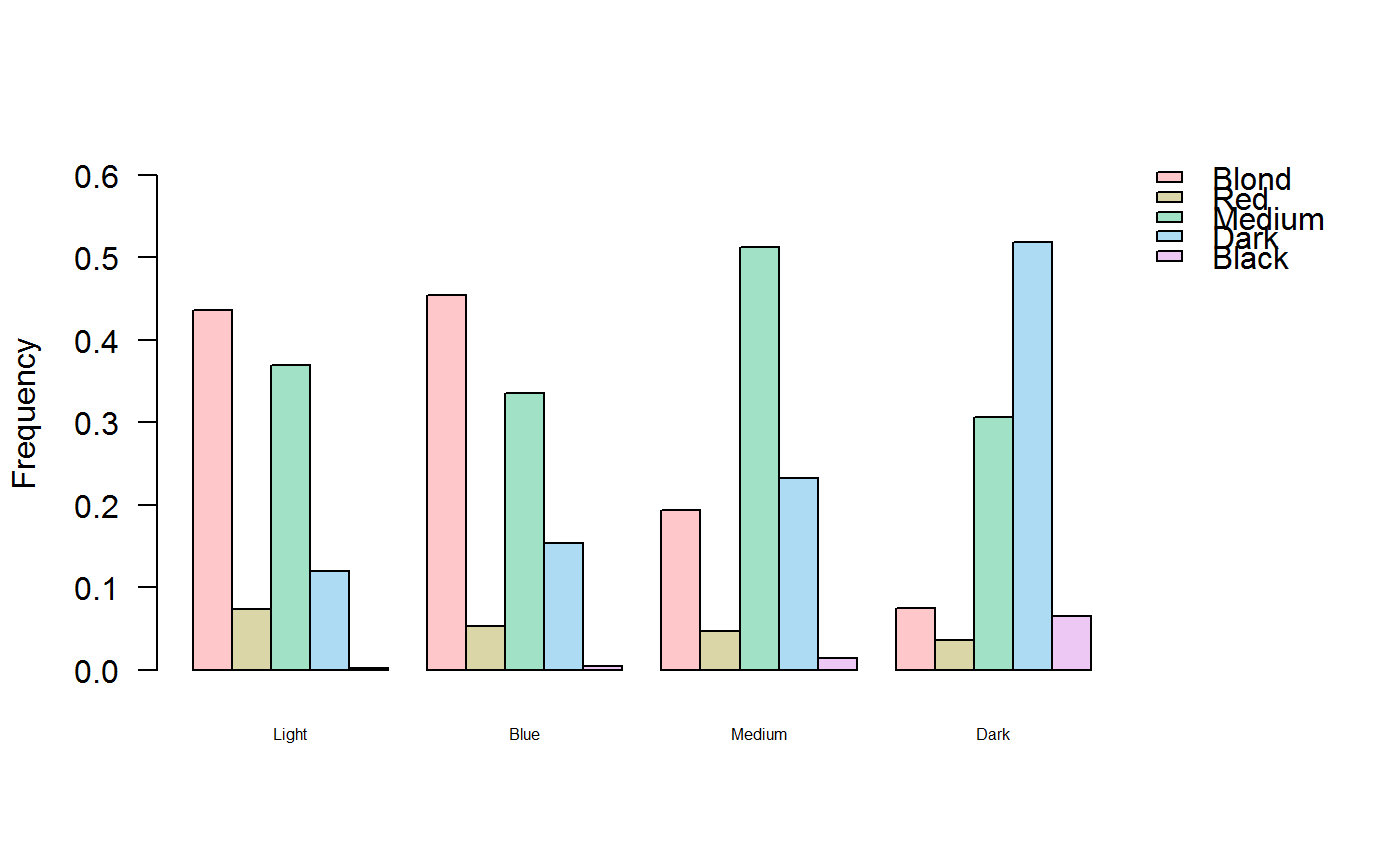
X <- matrix(c(688, 116, 584, 188, 4,
              326, 38, 241, 110, 3,
              343, 84, 909, 412, 26,
              98, 48, 403, 681, 85), nrow=4, byrow=TRUE)

dimnames(X) <- list(eye.color=c("Light","Blue", "Medium","Dark"),
                    hair.color=c("Blond","Red", "Medium","Dark", "Black"))

plot_prof(x=X, Row=TRUE)plot_prof(x=X, Row=FALSE, cex.names=0.9, cex=0.6)