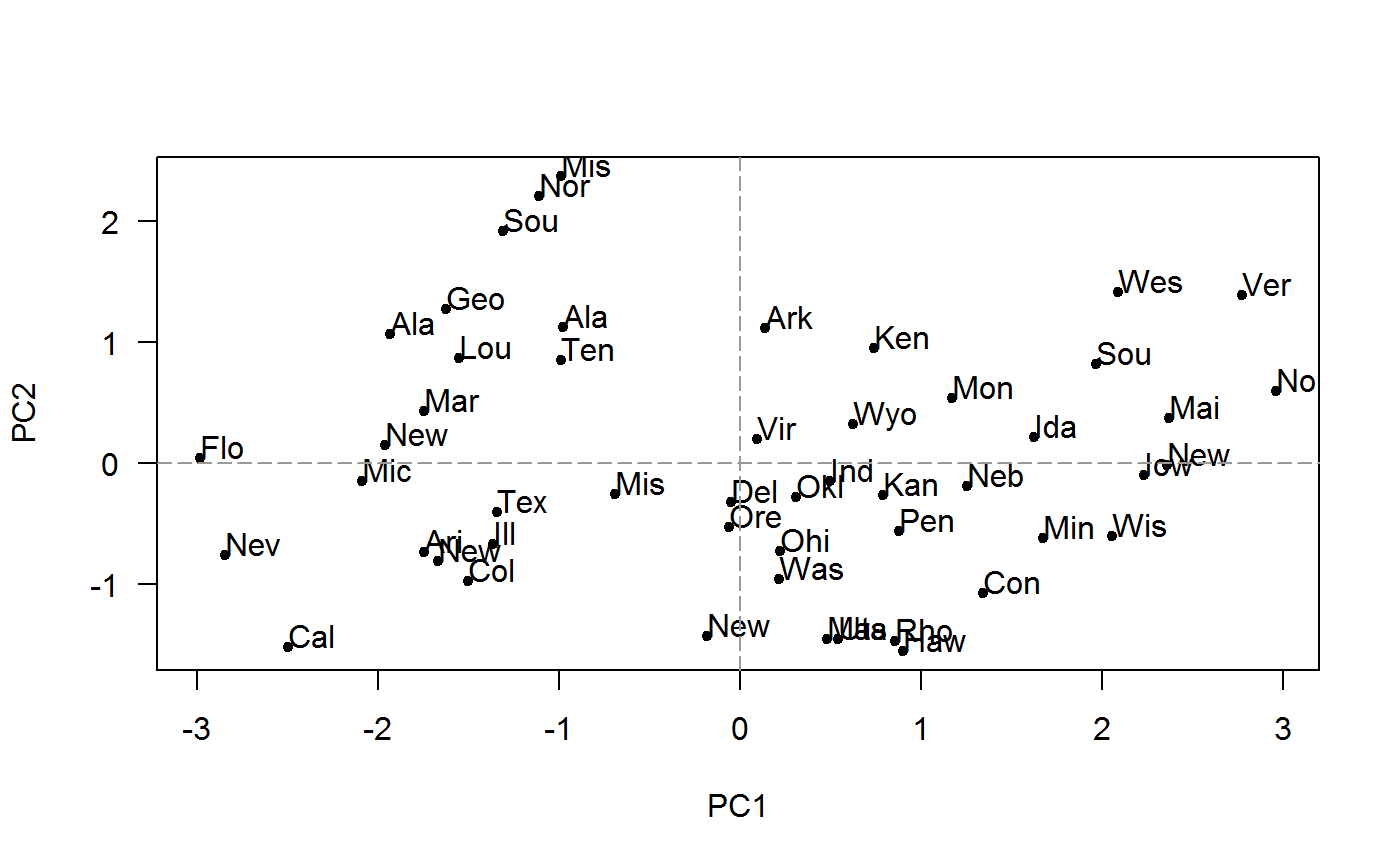
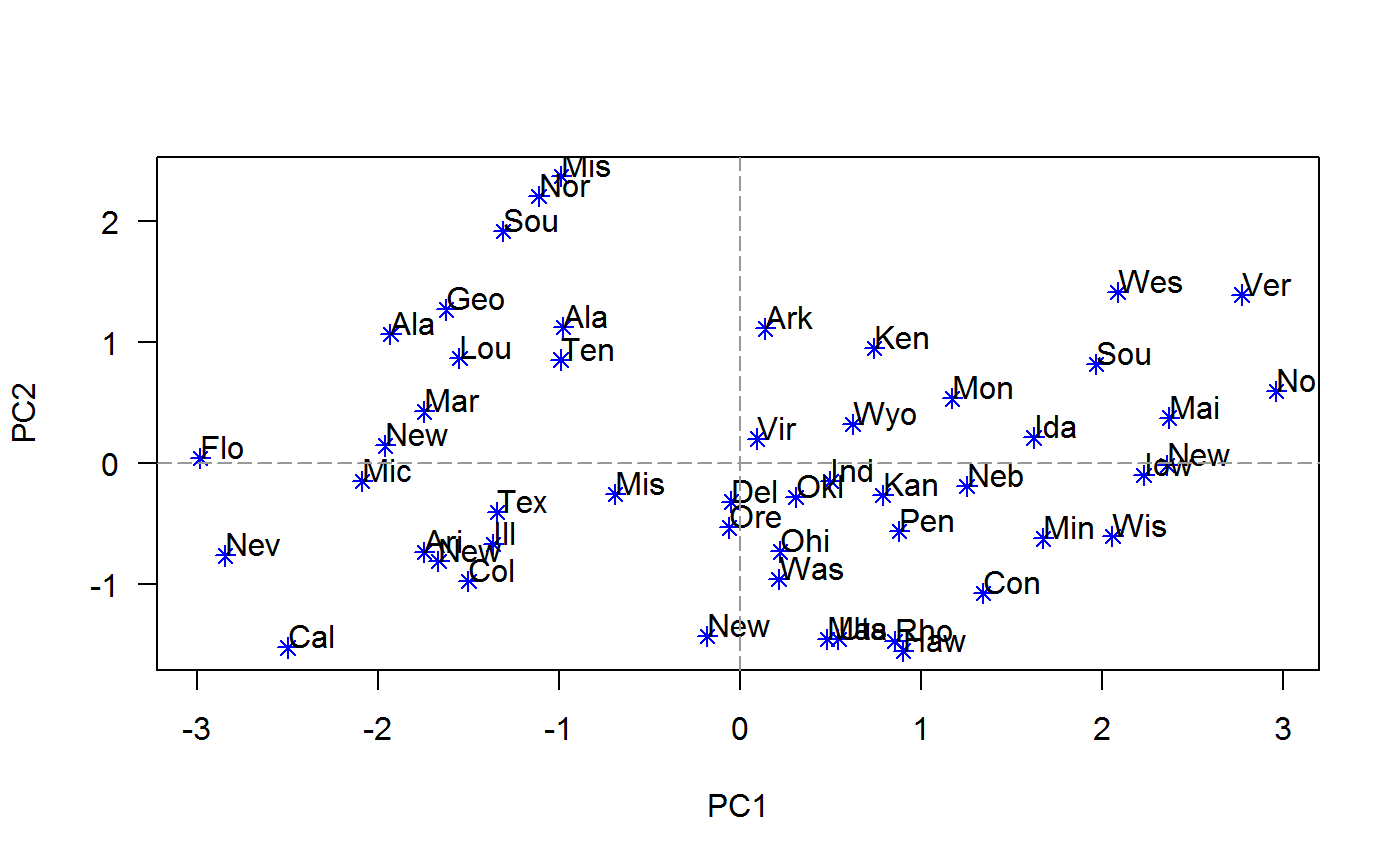
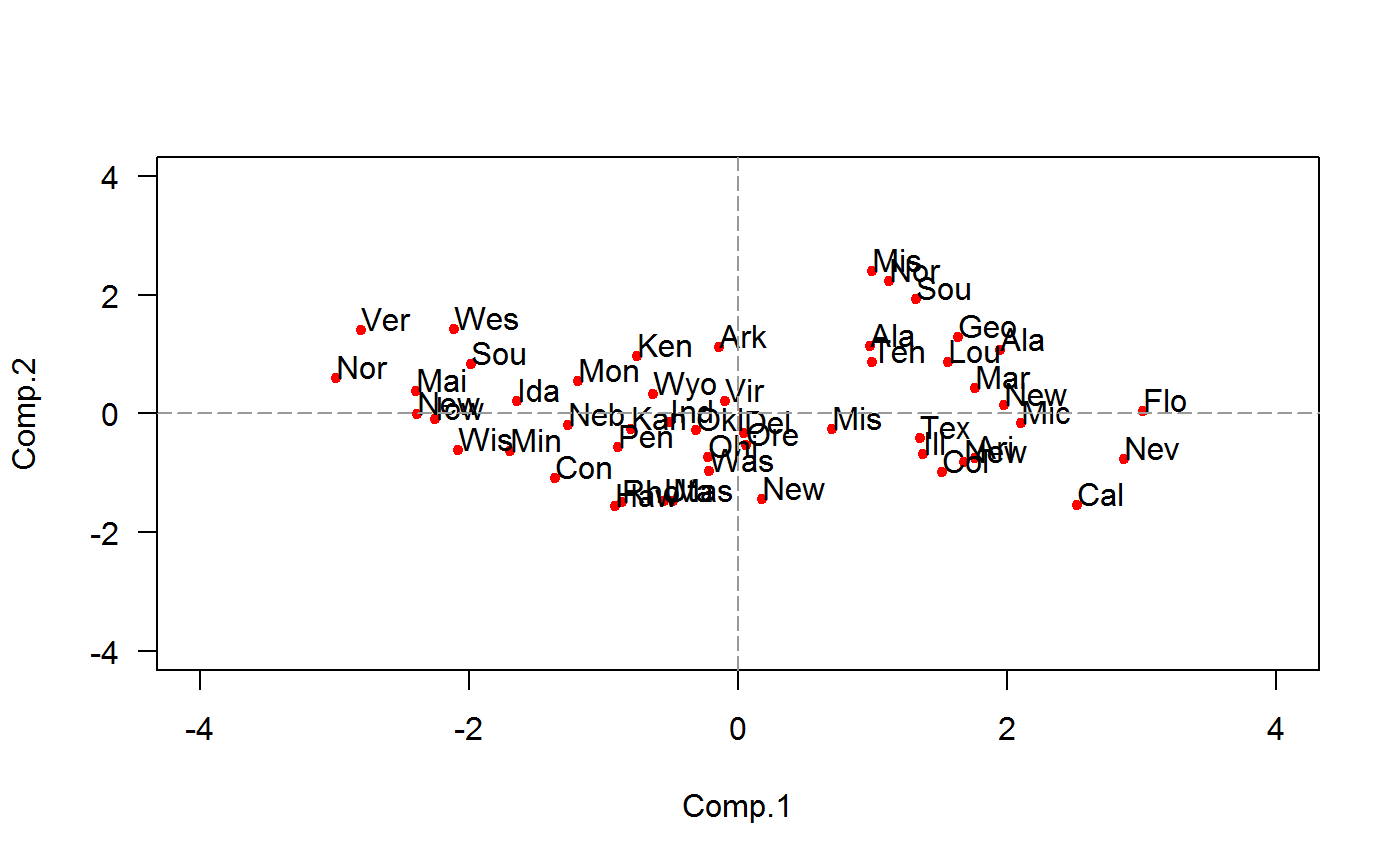
This function plots the observations in the coordinate plane PC1-PC2.
plot_obs_pc(mod, lchar = 3, pch = 20, ...)
Arguments
| mod | A prcomp or princomp object. |
|---|---|
| lchar | The number of first characters to identify points. |
| pch | an integer specifying a symbol or a single character to be used as the default in plotting points. |
| ... | Arguments to be passed to methods, such as graphical parameters (see par). |
Value
The function returns a list with two elements, coordinate points for first and second dimensions.
See also
[plot_var_pc()].
Examples
# For a prcomp object
pca1 <- prcomp(USArrests, scale=TRUE)  # Example
plot_obs_pc(pca1)                              # Default plotplot_obs_pc(pca1, lchar=3, col='blue', pch=8)  # Customized plot#
# For a princomp object
pca2 <- princomp(x=USArrests, cor=TRUE)
plot_obs_pc(pca2, col='red', ylim=c(-4, 4), xlim=c(-4, 4))