This function plots the original observations in the coordinate plane Fi-Fj from a factor analysis.
plot_obsfa(scores, fx = 1, fy = 2, lchar = 3, ...)Arguments
- scores
a matrix obtained from
factanalfunction.- fx
a number to indicate the factor to plot in x axis.
- fy
a number to indicate the factor to plot in y axis.
- lchar
the number of first characters to identify points, by default is 3.
- ...
arguments to be passed to methods, such as graphical parameters (see par).
Value
plot_obsfa function returns a plot with the
observations in the coordinate plane Fi-Fj from a factor analysis.
Details
The number in fx and fy must be less or equal
number of factors in factanal function.
Examples
v1 <- c(1,1,1,1,1,1,1,1,1,1,3,3,3,3,3,4,5,6)
v2 <- c(1,2,1,1,1,1,2,1,2,1,3,4,3,3,3,4,6,5)
v3 <- c(3,3,3,3,3,1,1,1,1,1,1,1,1,1,1,5,4,6)
v4 <- c(3,3,4,3,3,1,1,2,1,1,1,1,2,1,1,5,6,4)
v5 <- c(1,1,1,1,1,3,3,3,3,3,1,1,1,1,1,6,4,5)
v6 <- c(1,1,1,2,1,3,3,3,4,3,1,1,1,2,1,6,5,4)
m1 <- cbind(v1,v2,v3,v4,v5,v6)
scores <- factanal(m1, factors=3, method="mle",
scores="Bartlett")$scores
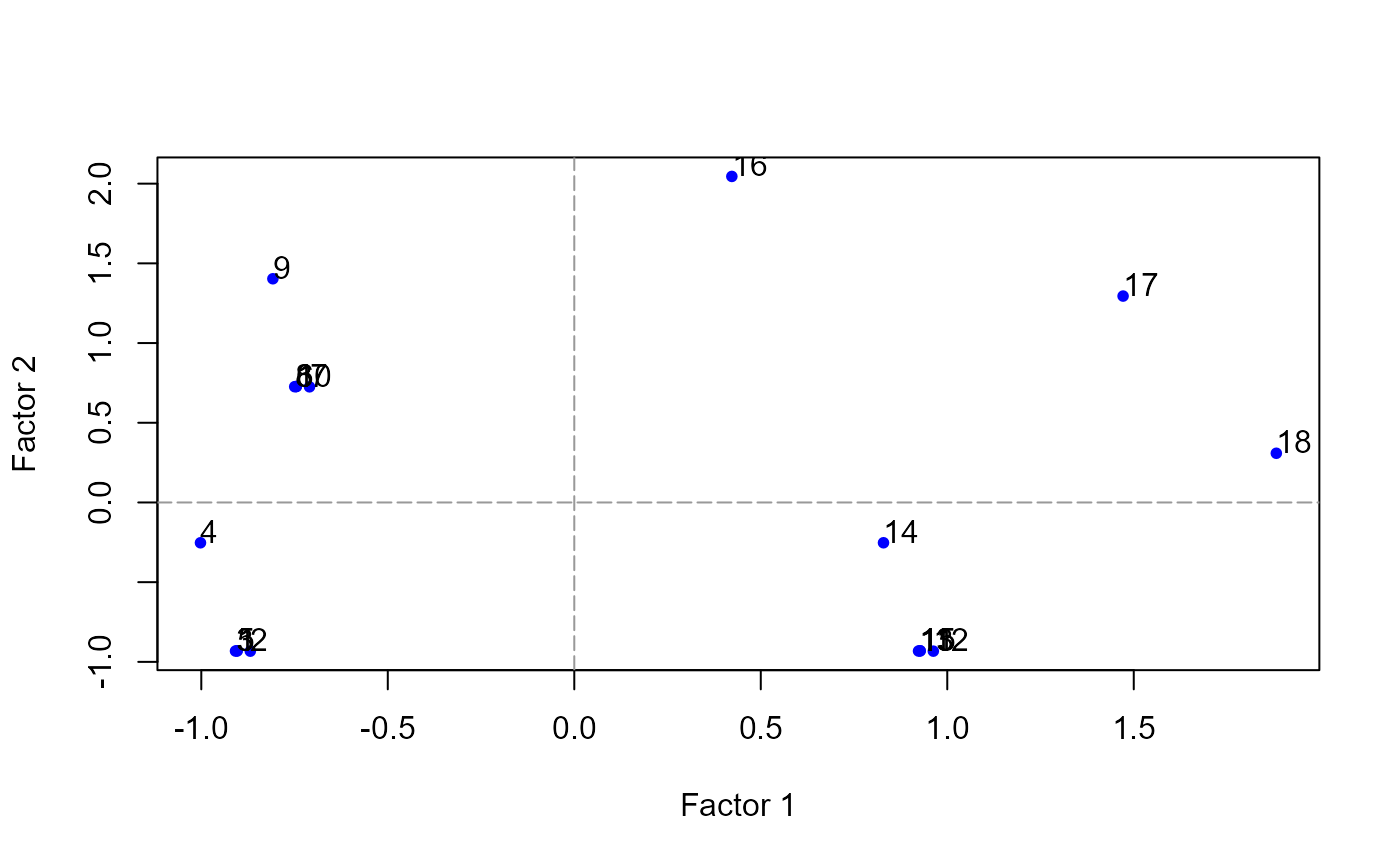
plot_obsfa(scores, fx=1, fy=2, col='blue', pch=20)
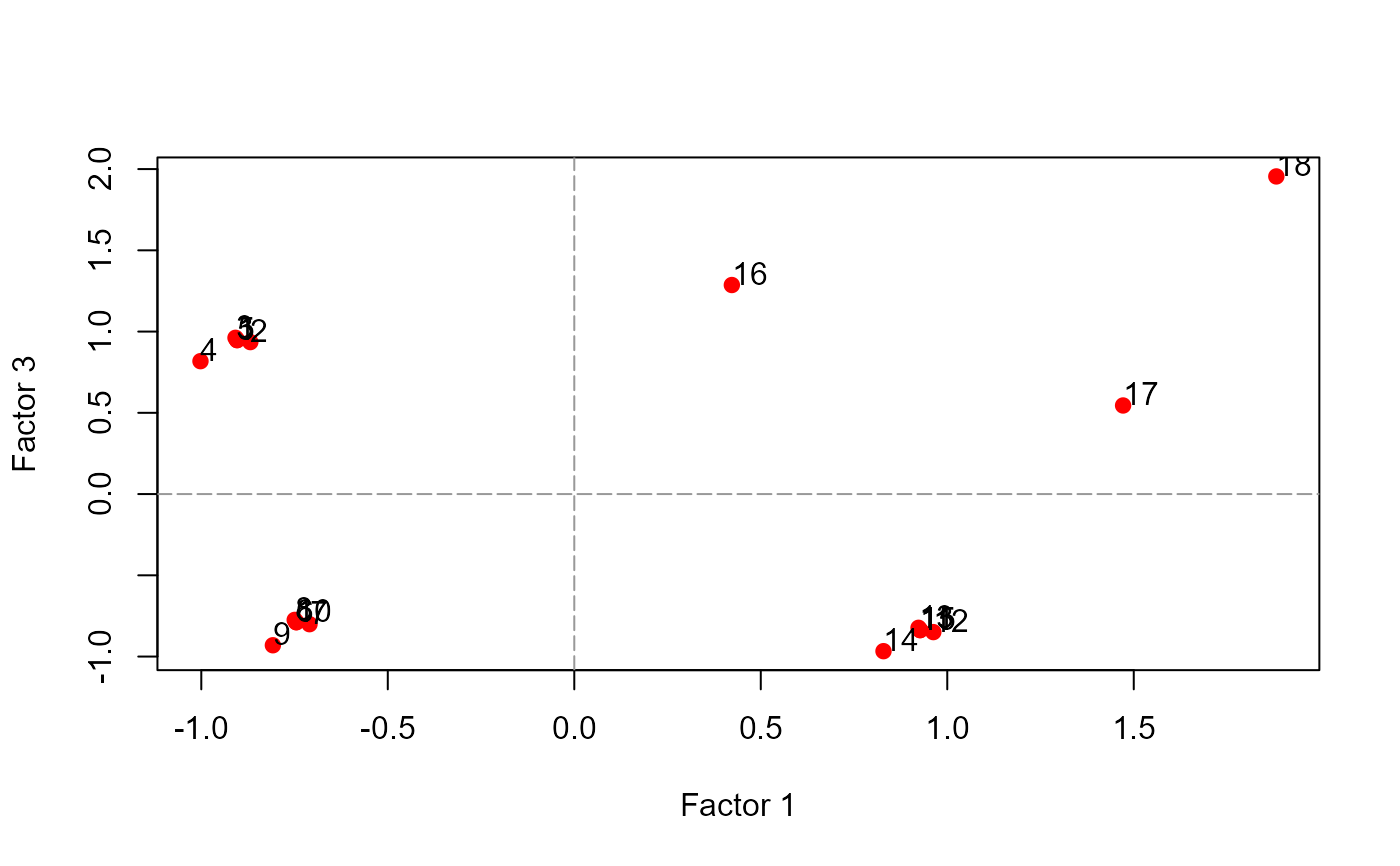
 plot_obsfa(scores, fx=1, fy=3, col='red', pch=19)