Density, distribution function, quantile function,
random generation and hazard function for the Lindley distribution
with parameter mu.
Usage
dLIN(x, mu, log = FALSE)

pLIN(q, mu, lower.tail = TRUE, log.p = FALSE)

qLIN(p, mu, lower.tail = TRUE, log.p = FALSE)

rLIN(n, mu)

hLIN(x, mu, log = FALSE)Value
dLIN gives the density, pLIN gives the distribution
function, qLIN gives the quantile function, rLIN
generates random deviates and hLIN gives the hazard function.
Details
Lindley Distribution with parameter mu has density given by
\(f(x) = \frac{\mu^2}{\mu+1} (1+x) \exp(-\mu x),\)
for \(x > 0\) and \(\mu > 0\). These function were taken form LindleyR package.
References
Lindley, D. V. (1958). Fiducial distributions and Bayes' theorem. Journal of the Royal Statistical Society. Series B (Methodological), 102-107.
Author
Freddy Hernandez, fhernanb@unal.edu.co
Examples
old_par <- par(mfrow = c(1, 1)) # save previous graphical parameters
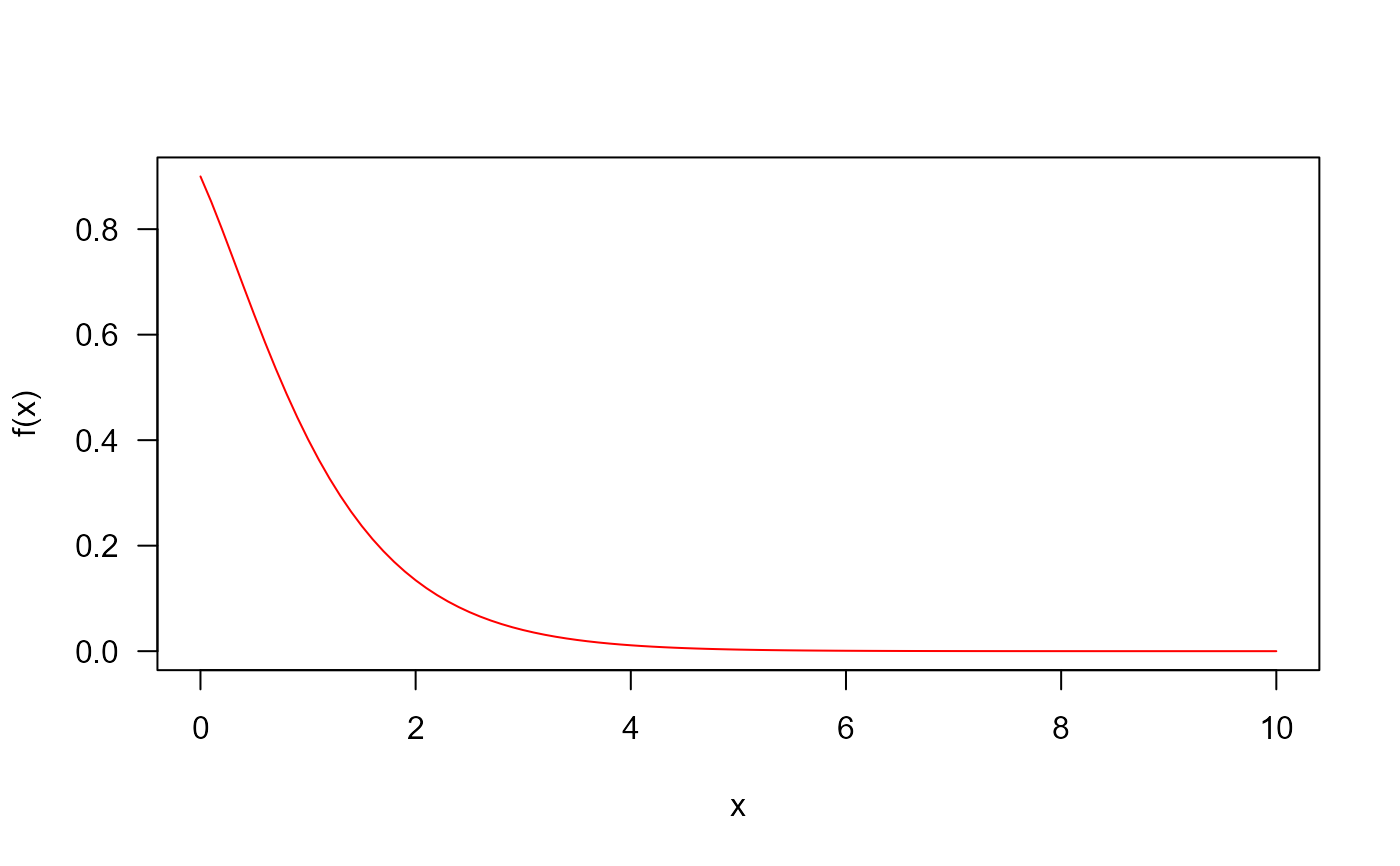
## The probability density function
curve(dLIN(x, mu=1.5), from=0.0001, to=10,
col="red", las=1, ylab="f(x)")
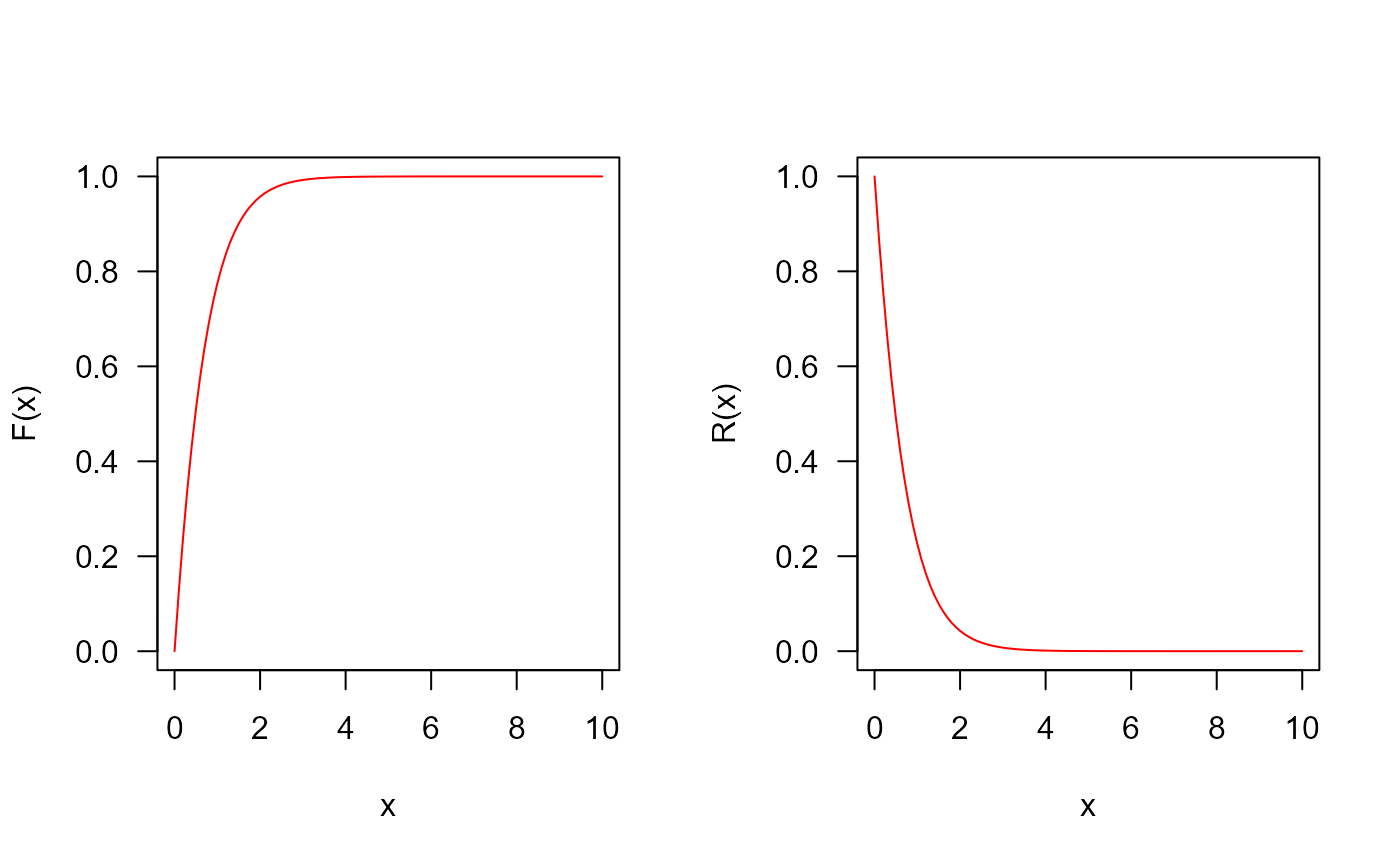
 ## The cumulative distribution and the Reliability function
par(mfrow=c(1, 2))
curve(pLIN(x, mu=2), from=0.0001, to=10, col="red", las=1, ylab="F(x)")
curve(pLIN(x, mu=2, lower.tail=FALSE), from=0.0001,
to=10, col="red", las=1, ylab="R(x)")
## The cumulative distribution and the Reliability function
par(mfrow=c(1, 2))
curve(pLIN(x, mu=2), from=0.0001, to=10, col="red", las=1, ylab="F(x)")
curve(pLIN(x, mu=2, lower.tail=FALSE), from=0.0001,
to=10, col="red", las=1, ylab="R(x)")
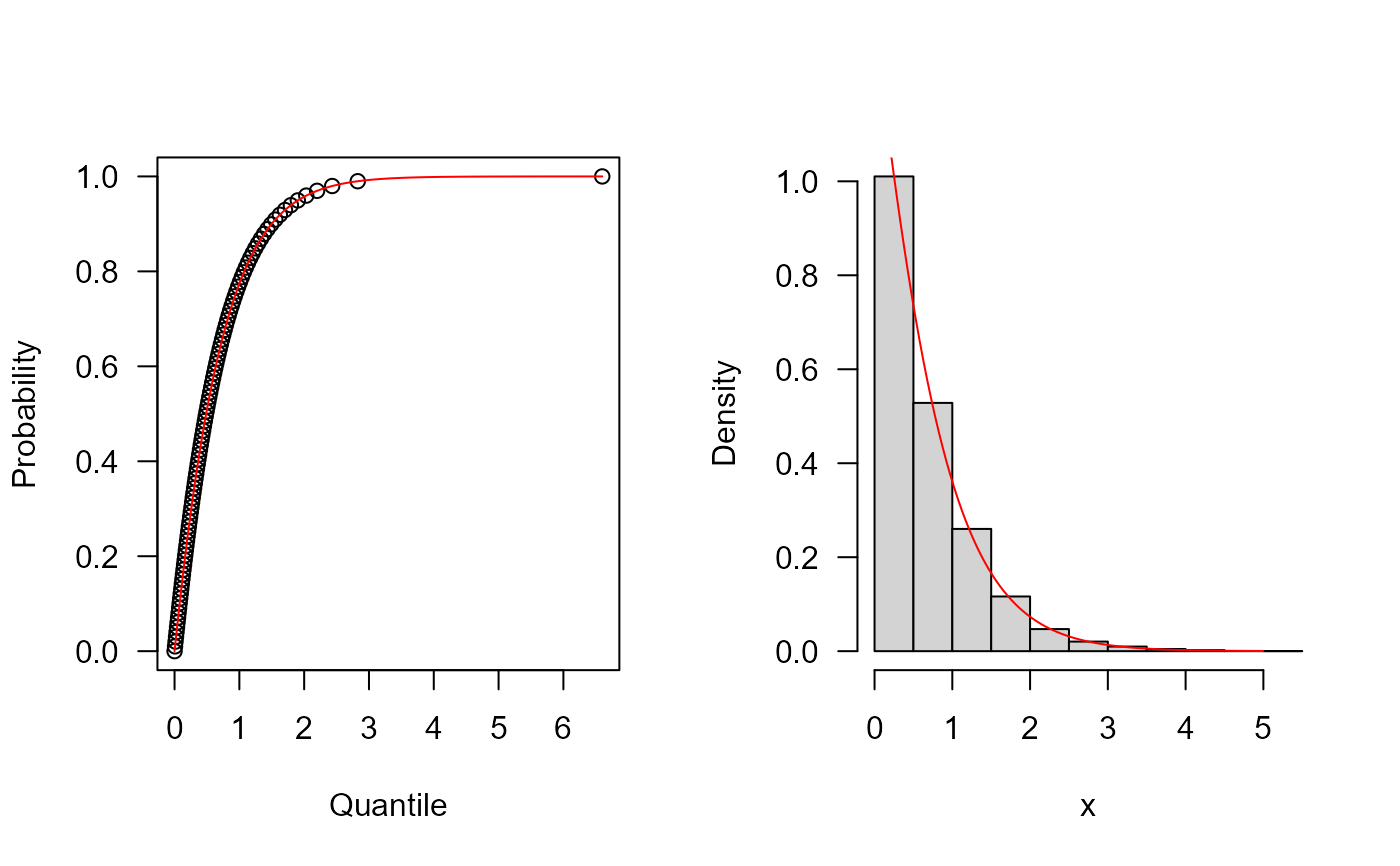
 ## The quantile function
p <- seq(from=0, to=0.99999, length.out=100)
plot(x=qLIN(p, mu=2), y=p, xlab="Quantile", las=1, ylab="Probability")
curve(pLIN(x, mu=2), from=0, add=TRUE, col="red")
## The random function
hist(rLIN(n=10000, mu=2), freq=FALSE, xlab="x", las=1, main="")
curve(dLIN(x, mu=2), from=0.09, to=5, add=TRUE, col="red")
## The quantile function
p <- seq(from=0, to=0.99999, length.out=100)
plot(x=qLIN(p, mu=2), y=p, xlab="Quantile", las=1, ylab="Probability")
curve(pLIN(x, mu=2), from=0, add=TRUE, col="red")
## The random function
hist(rLIN(n=10000, mu=2), freq=FALSE, xlab="x", las=1, main="")
curve(dLIN(x, mu=2), from=0.09, to=5, add=TRUE, col="red")
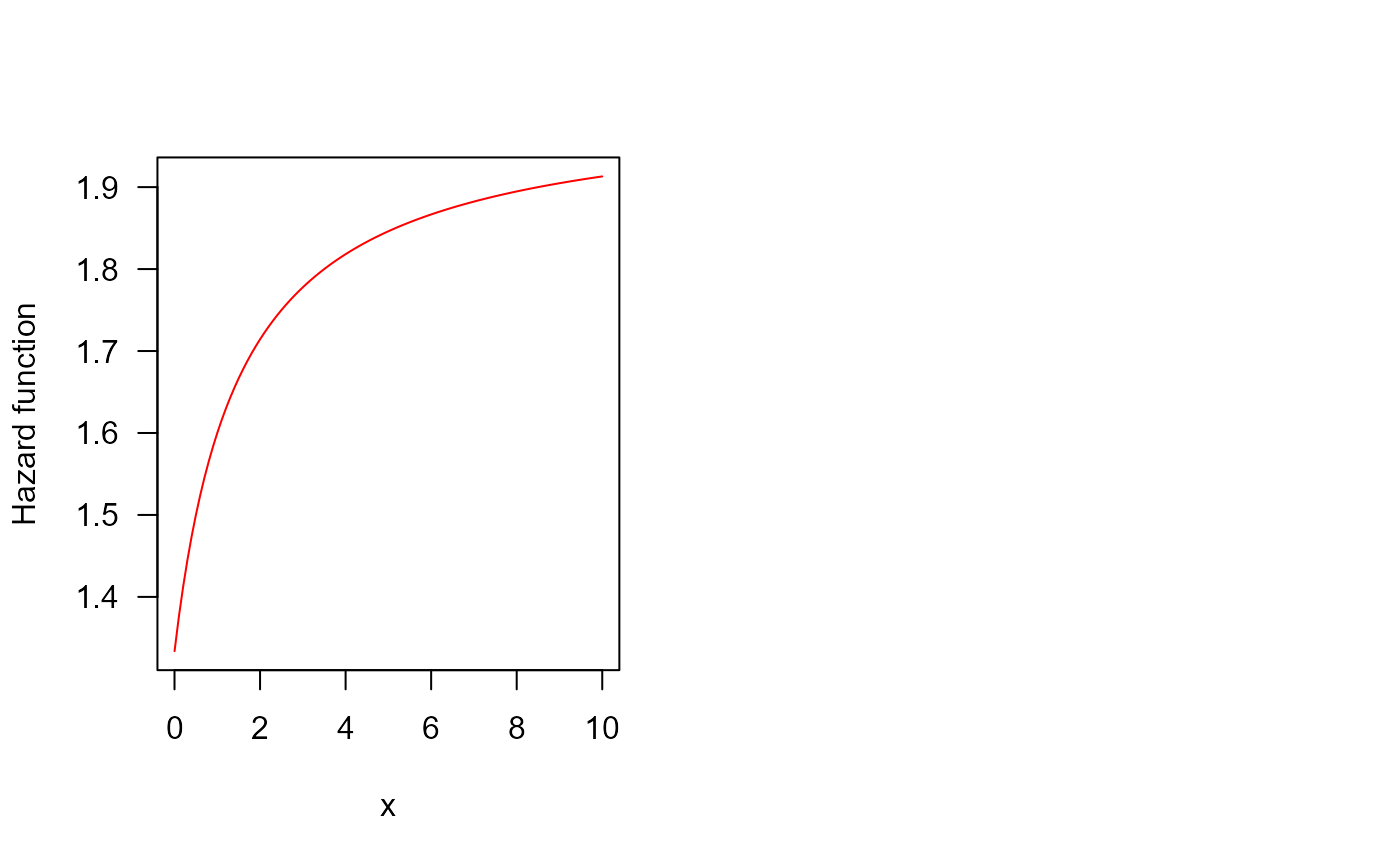
 ## The Hazard function
curve(hLIN(x, mu=2), from=0.001, to=10, col="red", ylab="Hazard function", las=1)
par(old_par) # restore previous graphical parameters
## The Hazard function
curve(hLIN(x, mu=2), from=0.001, to=10, col="red", ylab="Hazard function", las=1)
par(old_par) # restore previous graphical parameters