Density, distribution function, quantile function, random generation and
hazard function for the generalized Weibull distribution with parameters
mu, sigma and nu.
Usage
dGWF(x, mu, sigma, nu, log = FALSE)

pGWF(q, mu, sigma, nu, lower.tail = TRUE, log.p = FALSE)

qGWF(p, mu, sigma, nu)

rGWF(n, mu, sigma, nu)

hGWF(x, mu, sigma, nu)Value
dGWF gives the density, pGWF gives the distribution
function, qGWF gives the quantile function, rGWF
generates random deviates and hGWF gives the hazard function.
Details
The generalized Weibull with parameters mu, sigma and
nu has density given by
$$f(x) = \mu \sigma x^{\sigma - 1} \left( 1 - \mu \nu x^\sigma \right)^{\frac{1}{\nu} - 1}$$
for \(x > 0\), \(\mu>0\), \(\sigma>0\) and \(-\infty<\nu<\infty\).
References
Mudholkar, G. S., & Kollia, G. D. (1994). Generalized Weibull family: a structural analysis. Communications in statistics-theory and methods, 23(4), 1149-1171.
Author
Jaime Mosquera, jmosquerag@unal.edu.co
Examples
old_par <- par(mfrow = c(1, 1)) # save previous graphical parameters
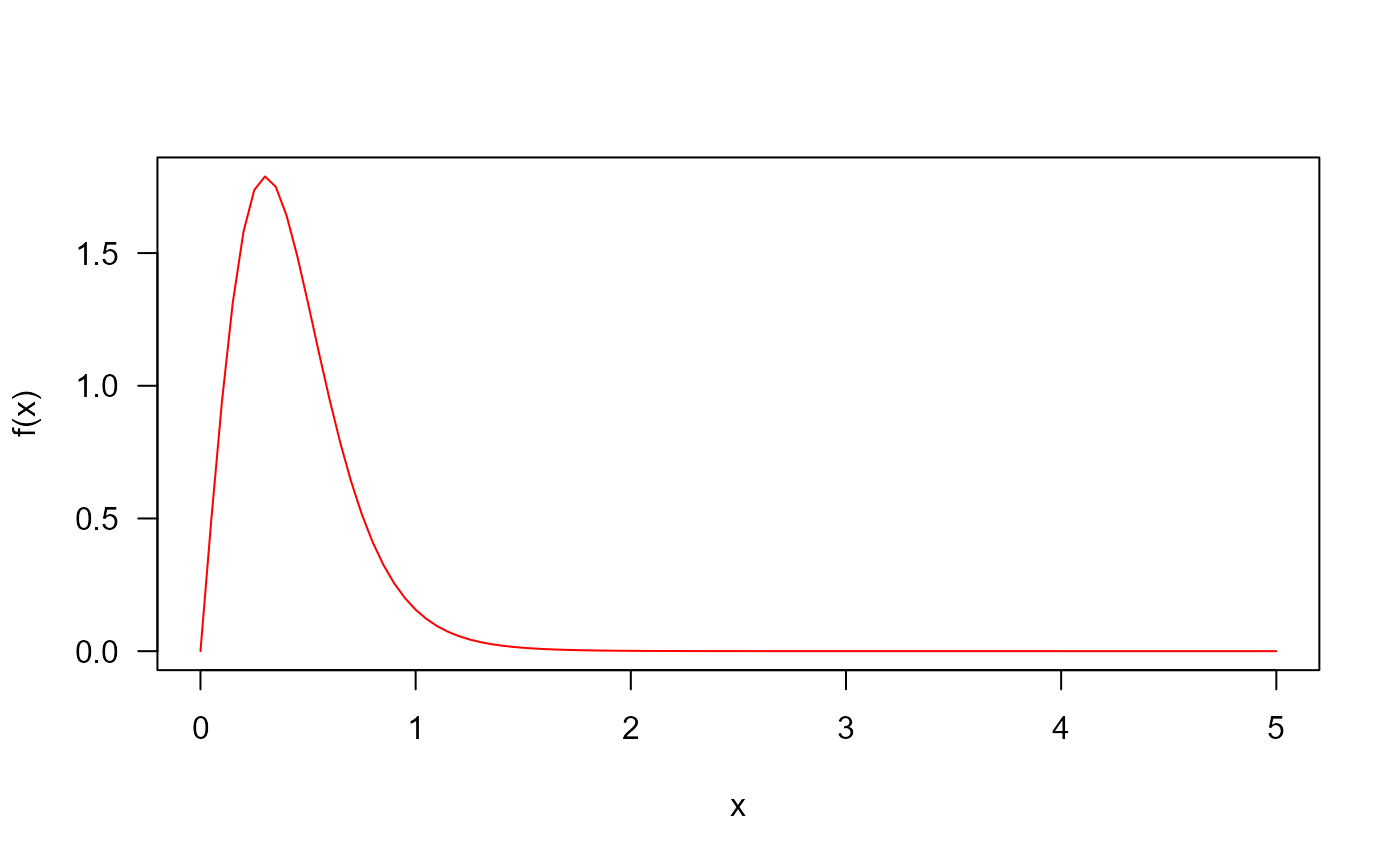
## The probability density function
curve(
dGWF(x, mu = 5, sigma = 2, nu = -0.2),
from = 0, to = 5, col = "red", las = 1, ylab = "f(x)"
)
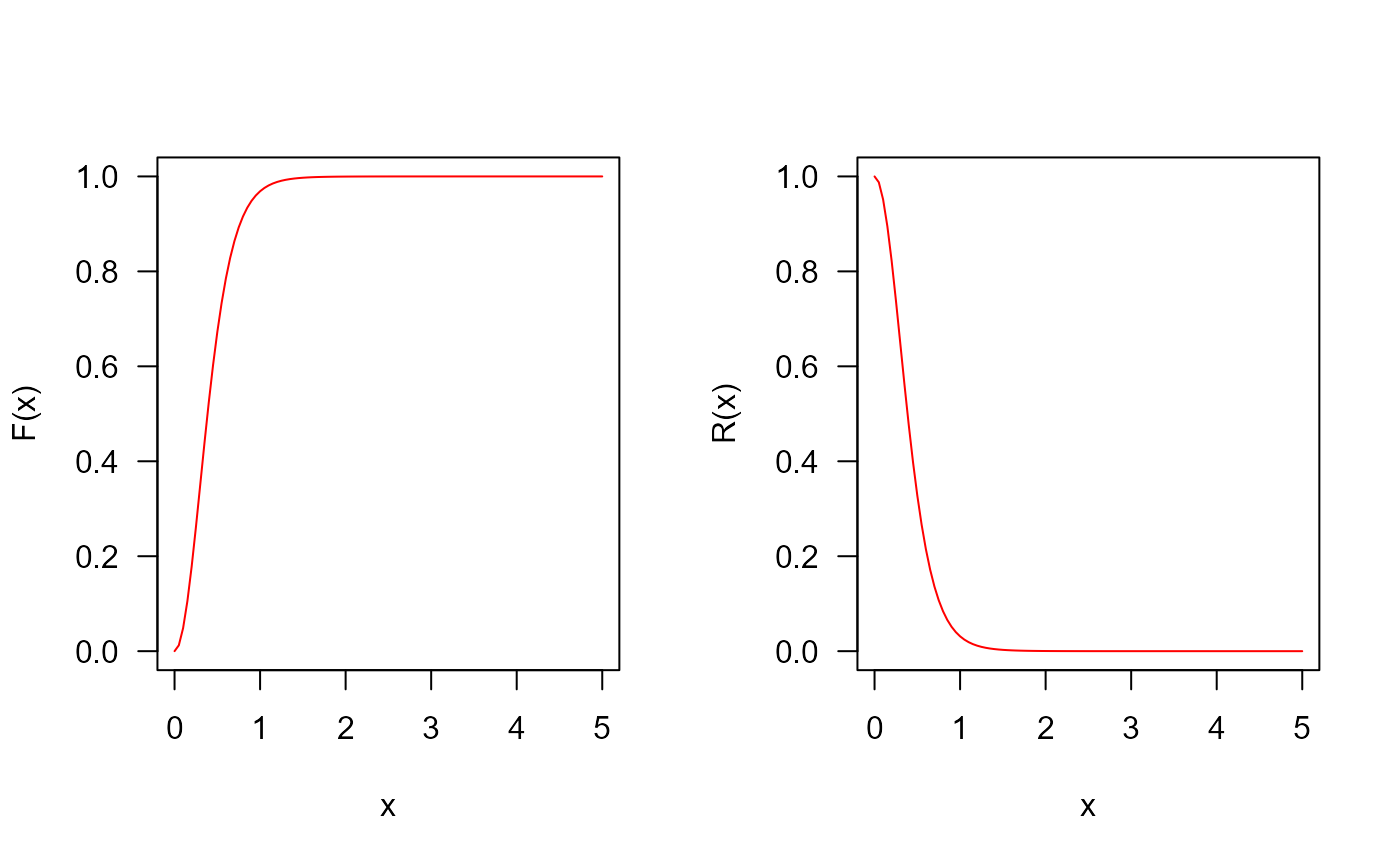
 ## The cumulative distribution and the Reliability function
par(mfrow = c(1, 2))
curve(
pGWF(x, mu = 5, sigma = 2, nu = -0.2),
from = 0, to = 5, ylim = c(0, 1),
col = "red", las = 1, ylab = "F(x)"
)
curve(
pGWF(
x, mu = 5, sigma = 2, nu = -0.2,
lower.tail = FALSE
),
from = 0, to = 5, ylim = c(0, 1),
col = "red", las = 1, ylab = "R(x)"
)
## The cumulative distribution and the Reliability function
par(mfrow = c(1, 2))
curve(
pGWF(x, mu = 5, sigma = 2, nu = -0.2),
from = 0, to = 5, ylim = c(0, 1),
col = "red", las = 1, ylab = "F(x)"
)
curve(
pGWF(
x, mu = 5, sigma = 2, nu = -0.2,
lower.tail = FALSE
),
from = 0, to = 5, ylim = c(0, 1),
col = "red", las = 1, ylab = "R(x)"
)
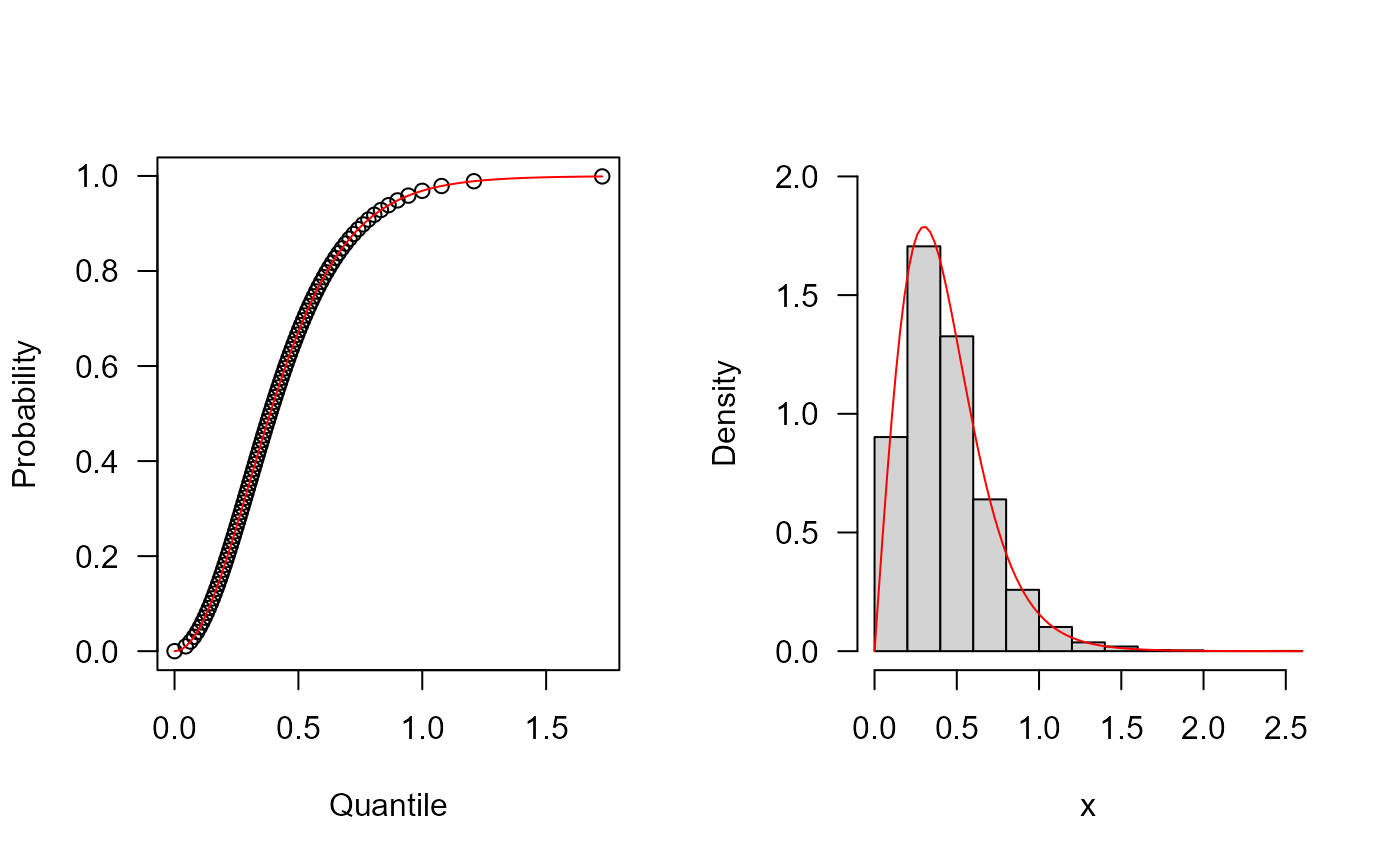
 ## The quantile function
p <- seq(from = 0, to = 0.999, length.out = 100)
plot(
x = qGWF(p, mu = 5, sigma = 2, nu = -0.2),
y = p, xlab = "Quantile", las = 1,
ylab = "Probability"
)
curve(
pGWF(x, mu = 5, sigma = 2, nu = -0.2),
from = 0, add = TRUE, col = "red"
)
## The random function
hist(
rGWF(n = 10000, mu = 5, sigma = 2, nu = -0.2),
freq = FALSE, xlab = "x", las = 1, main = "", ylim = c(0, 2.0)
)
curve(dGWF(x, mu = 5, sigma = 2, nu = -0.2),
from = 0, add = TRUE, col = "red"
)
## The quantile function
p <- seq(from = 0, to = 0.999, length.out = 100)
plot(
x = qGWF(p, mu = 5, sigma = 2, nu = -0.2),
y = p, xlab = "Quantile", las = 1,
ylab = "Probability"
)
curve(
pGWF(x, mu = 5, sigma = 2, nu = -0.2),
from = 0, add = TRUE, col = "red"
)
## The random function
hist(
rGWF(n = 10000, mu = 5, sigma = 2, nu = -0.2),
freq = FALSE, xlab = "x", las = 1, main = "", ylim = c(0, 2.0)
)
curve(dGWF(x, mu = 5, sigma = 2, nu = -0.2),
from = 0, add = TRUE, col = "red"
)
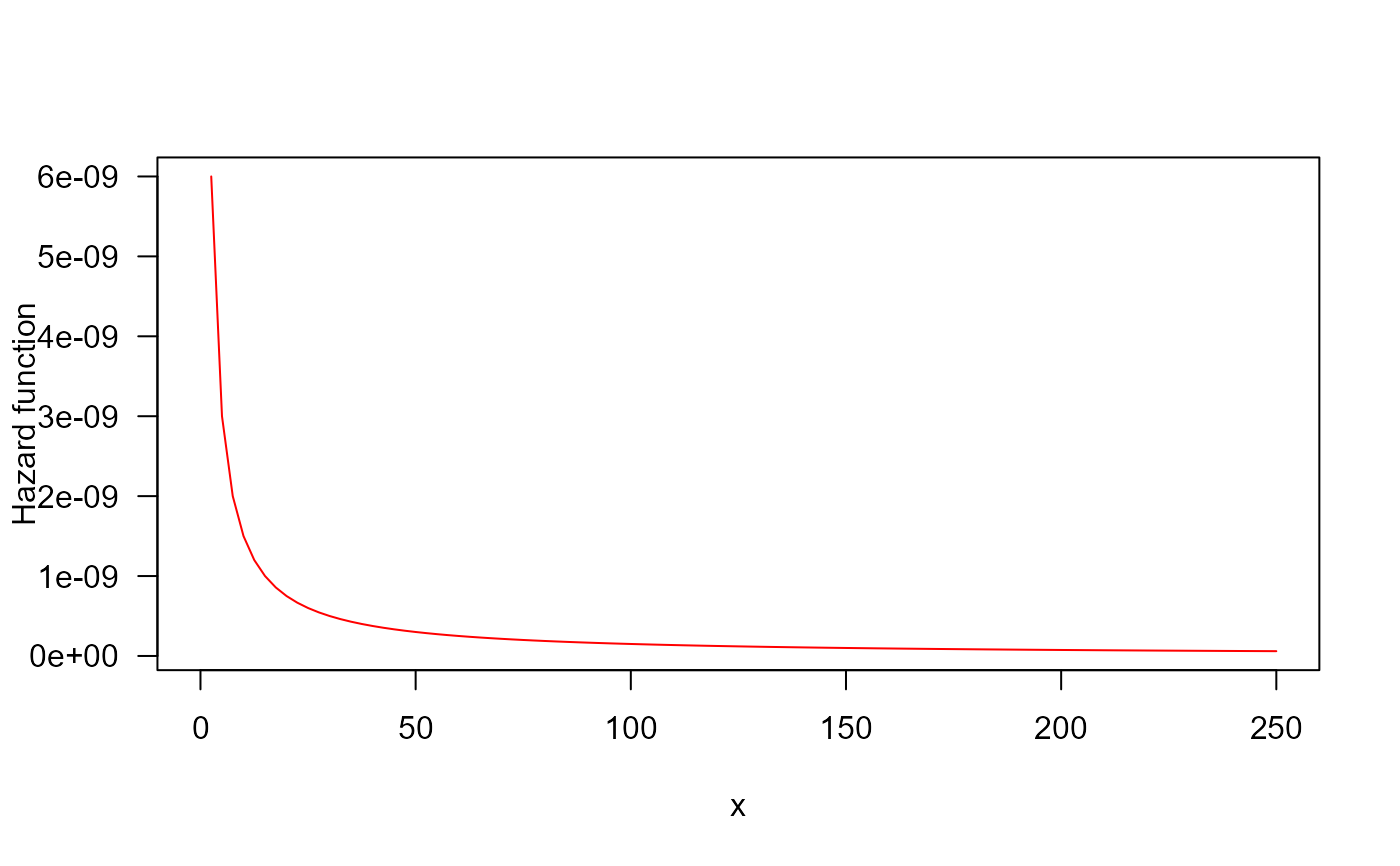
 ## The Hazard function
par(mfrow = c(1, 1))
curve(
hGWF(x, mu = 0.003, sigma = 5e-6, nu = 0.025),
from = 0, to = 250, col = "red",
ylab = "Hazard function", las = 1
)
## The Hazard function
par(mfrow = c(1, 1))
curve(
hGWF(x, mu = 0.003, sigma = 5e-6, nu = 0.025),
from = 0, to = 250, col = "red",
ylab = "Hazard function", las = 1
)
 par(old_par) # restore previous graphical parameters