Density, distribution function, quantile function and
random generation for the Beta Transformed Lomax distribution with
parameters mu, sigma and nu.
Usage
dBTL(x, mu = 1.5, sigma = 1.5, nu = 2, log = FALSE)

pBTL(q, mu = 1.5, sigma = 1.5, nu = 2, lower.tail = TRUE, log.p = FALSE)

qBTL(p, mu = 1.5, sigma = 1.5, nu = 2, lower.tail = TRUE, log.p = FALSE)

rBTL(n, mu = 1.5, sigma = 1.5, nu = 2)Value
dBTL gives the density, pBTL gives the distribution
function, qBTL gives the quantile function and rBTL
generates random deviates.
Details
The Beta Transformed Lomax distribution with parameters mu,
sigma and nu has density given by
\(f(x) = \frac{\log \nu}{\nu-1} \frac{\sigma}{\mu} \left(1+\frac{x}{\mu}\right)^{-(\sigma+1)} \nu^{\left(1+\frac{x}{\mu}\right)^{-\sigma}},\)
for \(\nu \neq 1\), and for \(\nu = 1\):
\(f(x) = \frac{\sigma}{\mu} \left(1+\frac{x}{\mu}\right)^{-(\sigma+1)},\)
for \(x \geq 0\), \(\mu > 0\), \(\sigma > 0\) and \(\nu > 0\).
References
Kottakkunnan, F. A New Generalization of Lomax Distribution: Estimation and Modelling for Medical Data. J Stat Theory Appl 25, 19 (2026). https://doi.org/10.1007/s44199-026-00171-0
See also
BTL.
Author
Marieth Guillen, mguillen@unal.edu.co
Examples
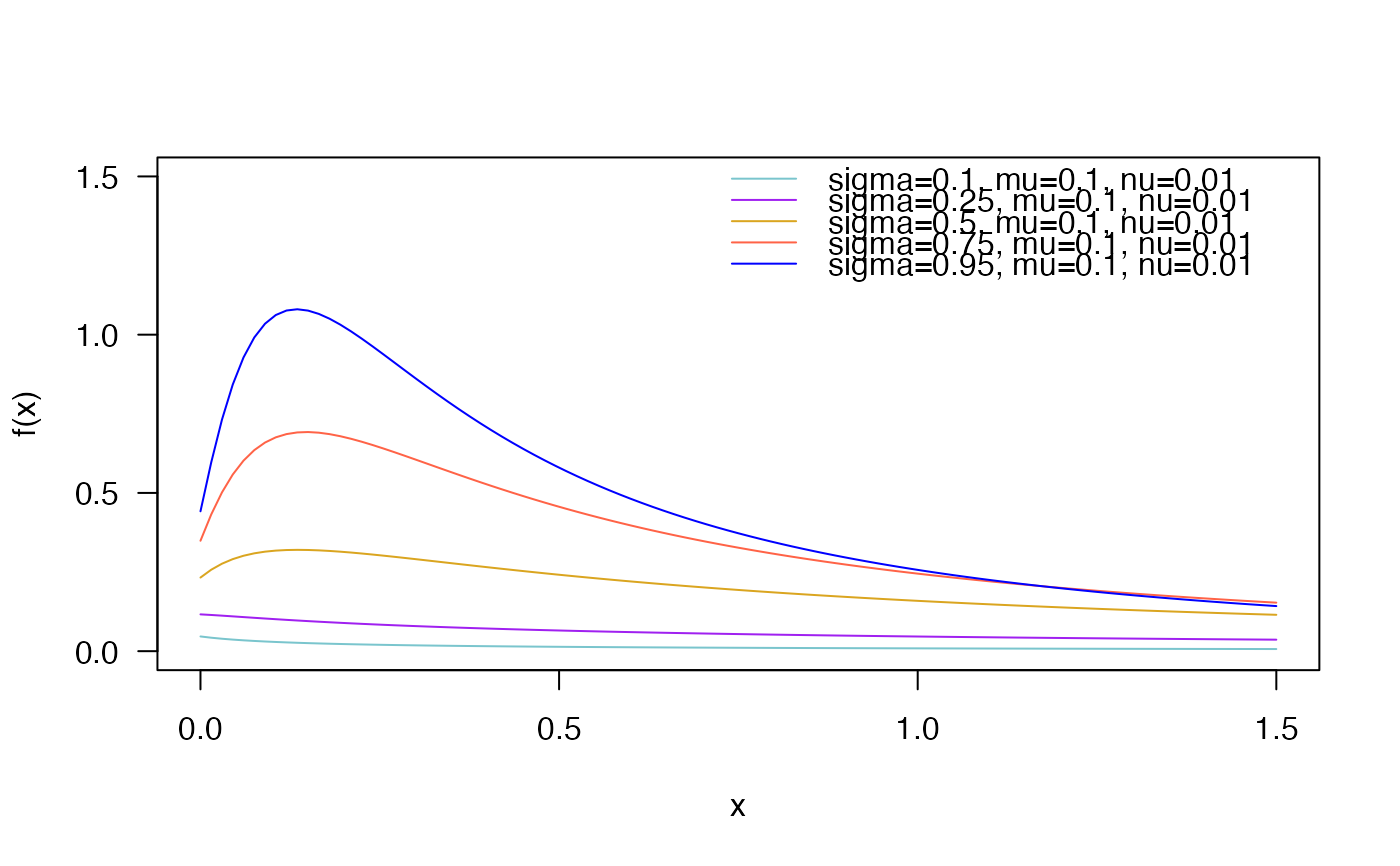
# Example 1
# Plotting the density function for different parameter values
curve(dBTL(x, sigma=0.1, mu=0.1, nu=0.01),
ylim=c(0, 1.5),
from=0, to=1.5, col="cadetblue3",
las=1, ylab="f(x)")
curve(dBTL(x, sigma=0.25, mu=0.1, nu=0.01),
add=TRUE, col= "purple")
curve(dBTL(x, sigma=0.5, mu=0.1, nu=0.01),
add=TRUE, col="goldenrod")
curve(dBTL(x, sigma=0.75, mu=0.1, nu=0.01),
add=TRUE, col="tomato")
curve(dBTL(x, sigma=0.95, mu=0.1, nu=0.01),
add=TRUE, col="blue")
legend("topright", col=c("cadetblue3", "purple", "goldenrod", "tomato", "blue"),
lty=1, bty="n", legend=c("sigma=0.1, mu=0.1, nu=0.01",
"sigma=0.25, mu=0.1, nu=0.01",
"sigma=0.5, mu=0.1, nu=0.01",
"sigma=0.75, mu=0.1, nu=0.01",
"sigma=0.95, mu=0.1, nu=0.01"))
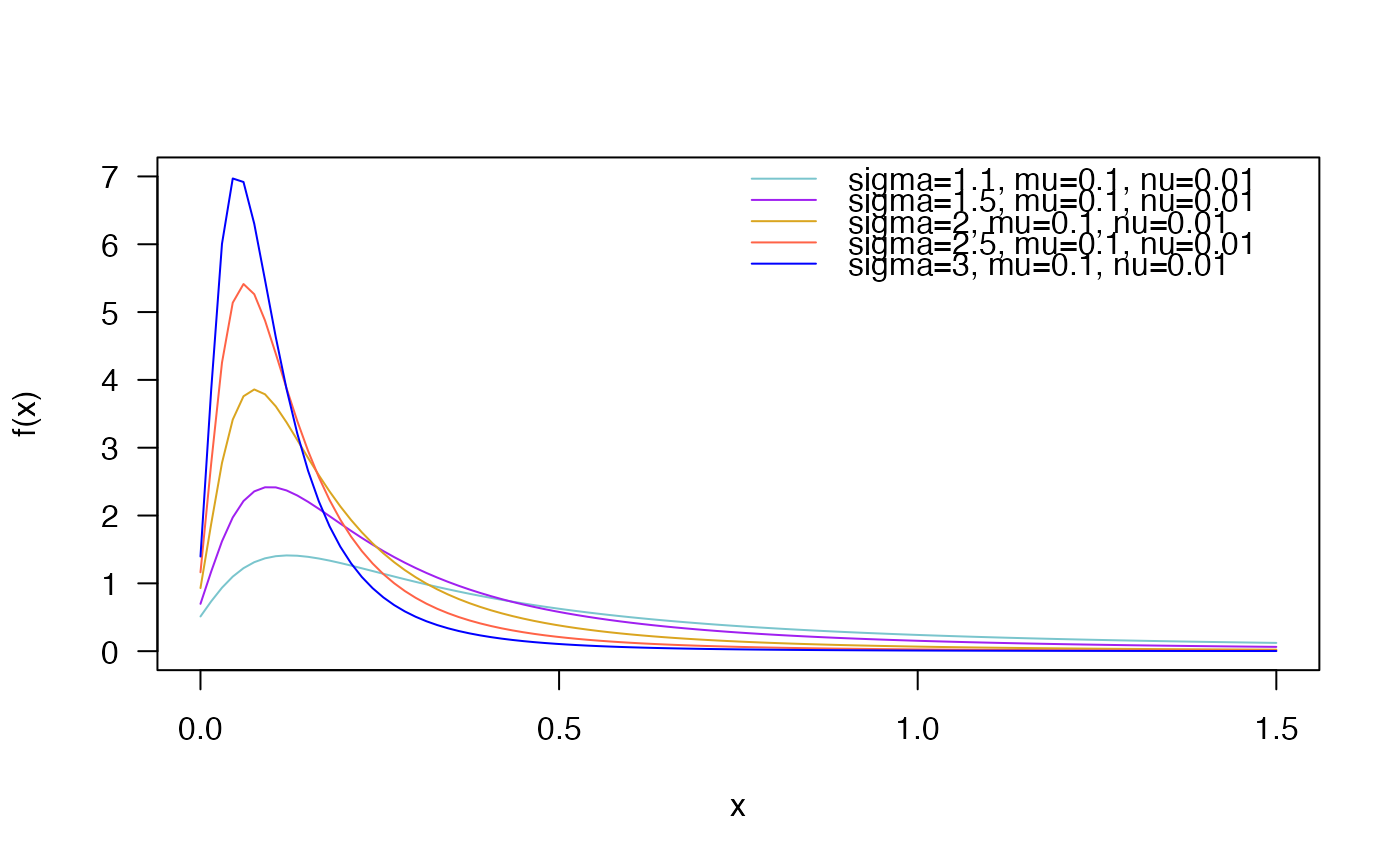
 curve(dBTL(x, sigma=1.1, mu=0.1, nu=0.01),
ylim=c(0, 7),
from=0, to=1.5, col="cadetblue3",
las=1, ylab="f(x)")
curve(dBTL(x, sigma=1.5, mu=0.1, nu=0.01),
add=TRUE, col= "purple")
curve(dBTL(x, sigma=2, mu=0.1, nu=0.01),
add=TRUE, col="goldenrod")
curve(dBTL(x, sigma=2.5, mu=0.1, nu=0.01),
add=TRUE, col="tomato")
curve(dBTL(x, sigma=3, mu=0.1, nu=0.01),
add=TRUE, col="blue")
legend("topright", col=c("cadetblue3", "purple", "goldenrod", "tomato", "blue"),
lty=1, bty="n", legend=c("sigma=1.1, mu=0.1, nu=0.01",
"sigma=1.5, mu=0.1, nu=0.01",
"sigma=2, mu=0.1, nu=0.01",
"sigma=2.5, mu=0.1, nu=0.01",
"sigma=3, mu=0.1, nu=0.01"))
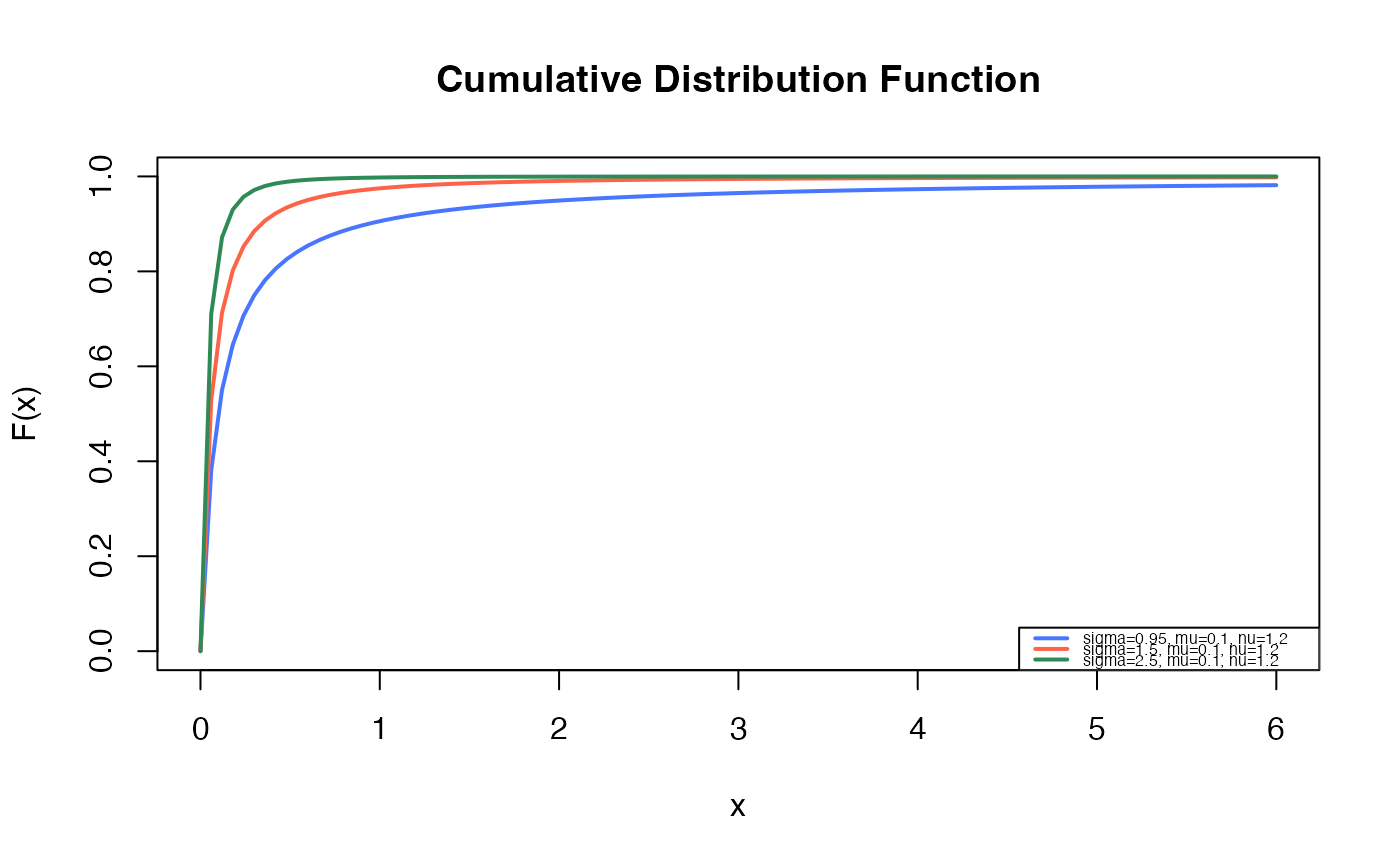
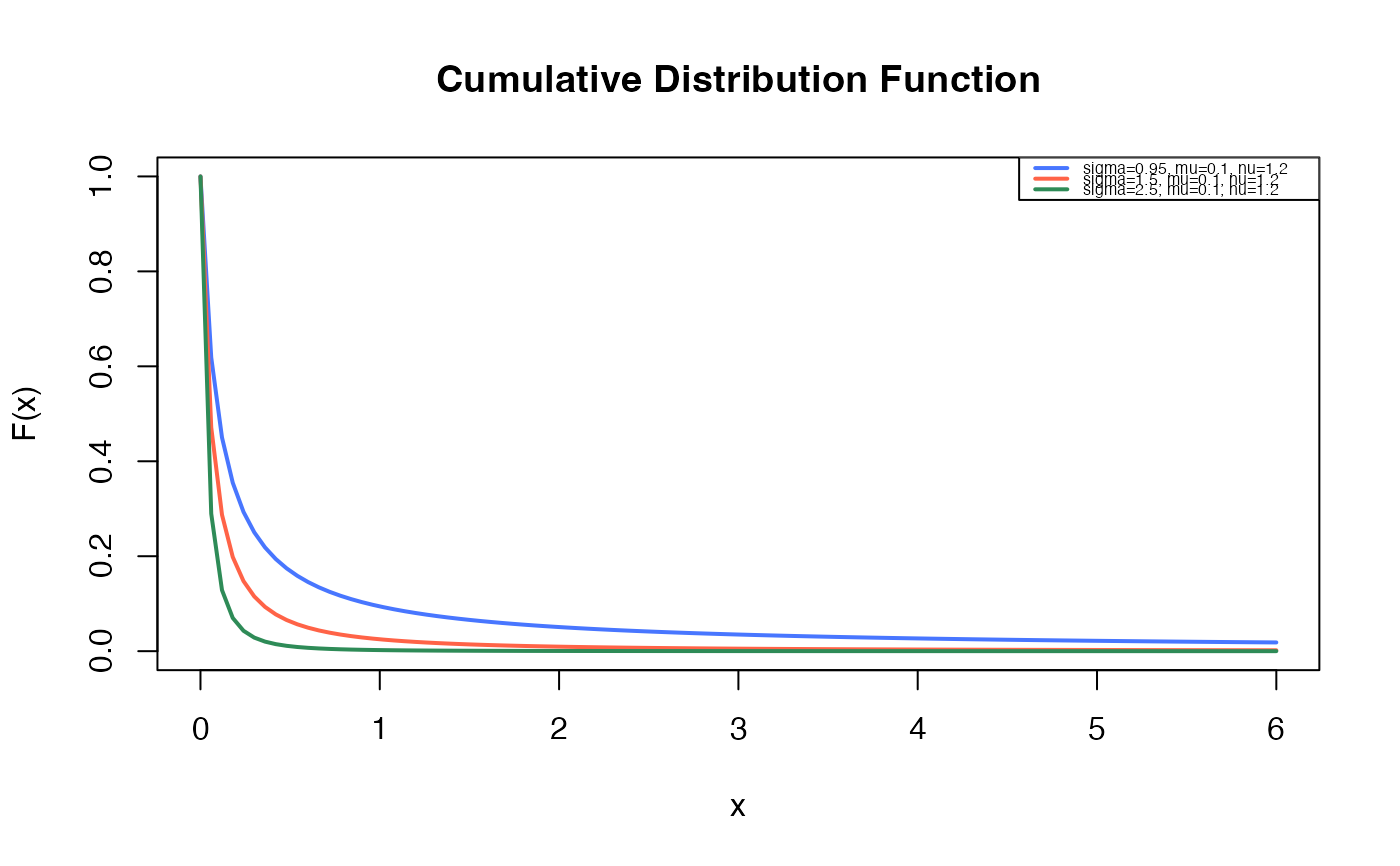
 # Example 2
# Checking if the cumulative curves converge to 1
curve(pBTL(x, sigma=0.95, mu=0.1, nu=1.2),
from=0, to=6,
ylim=c(0, 1),
col="royalblue1", lwd=2,
main="Cumulative Distribution Function",
xlab="x", ylab="F(x)")
curve(pBTL(x, sigma=1.5, mu=0.1, nu=1.2),
col="tomato",
lwd=2,
add=TRUE)
curve(pBTL(x, sigma=2.5, mu=0.1, nu=1.2),
col="seagreen",
lwd=2,
add=TRUE)
legend("bottomright", legend=c("sigma=0.95, mu=0.1, nu=1.2",
"sigma=1.5, mu=0.1, nu=1.2",
"sigma=2.5, mu=0.1, nu=1.2"),
col=c("royalblue1", "tomato", "seagreen"), lwd=2, cex=0.5)
 curve(pBTL(x, sigma=0.95, mu=0.1, nu=1.2, lower.tail=FALSE),
from=0, to=6,
ylim=c(0, 1),
col="royalblue1", lwd=2,
main="Cumulative Distribution Function",
xlab="x", ylab="F(x)")
curve(pBTL(x, sigma=1.5, mu=0.1, nu=1.2, lower.tail=FALSE),
col="tomato",
lwd=2,
add=TRUE)
curve(pBTL(x, sigma=2.5, mu=0.1, nu=1.2, lower.tail=FALSE),
col="seagreen",
lwd=2,
add=TRUE)
legend("topright", legend=c("sigma=0.95, mu=0.1, nu=1.2",
"sigma=1.5, mu=0.1, nu=1.2",
"sigma=2.5, mu=0.1, nu=1.2"),
col=c("royalblue1", "tomato", "seagreen"), lwd=2, cex=0.5)
 # Example 3
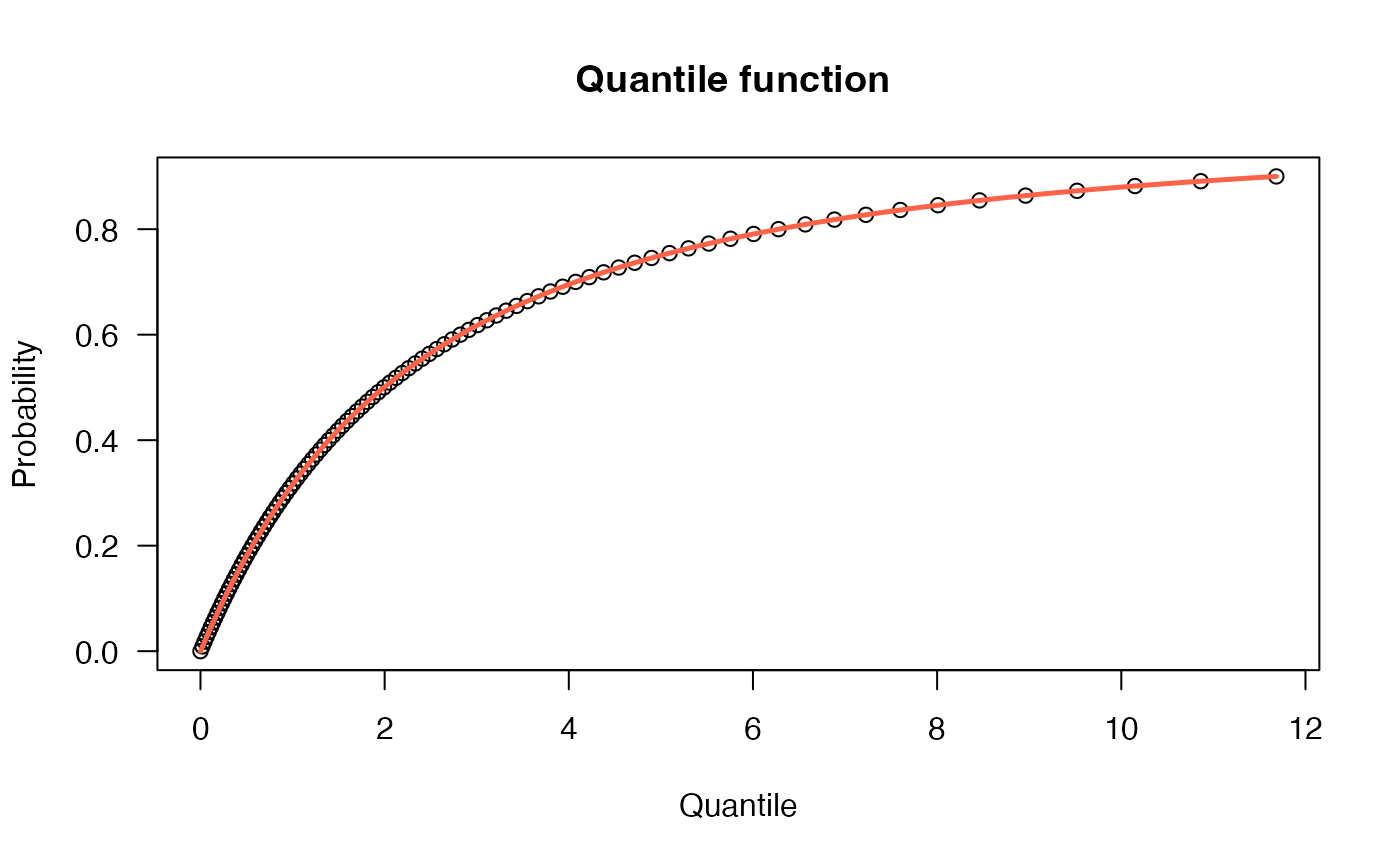
# The quantile function
p <- seq(from=0, to=0.9, length.out=100)
plot(x=qBTL(p, mu=2.5, sigma=1.5, nu=0.5), y=p, xlab="Quantile",
las=1, ylab="Probability", main="Quantile function ")
curve(pBTL(q=x, mu=2.5, sigma=1.5, nu=0.5),
from=0, add=TRUE, col="tomato", lwd=2.5)
 # Example 4
# The random function
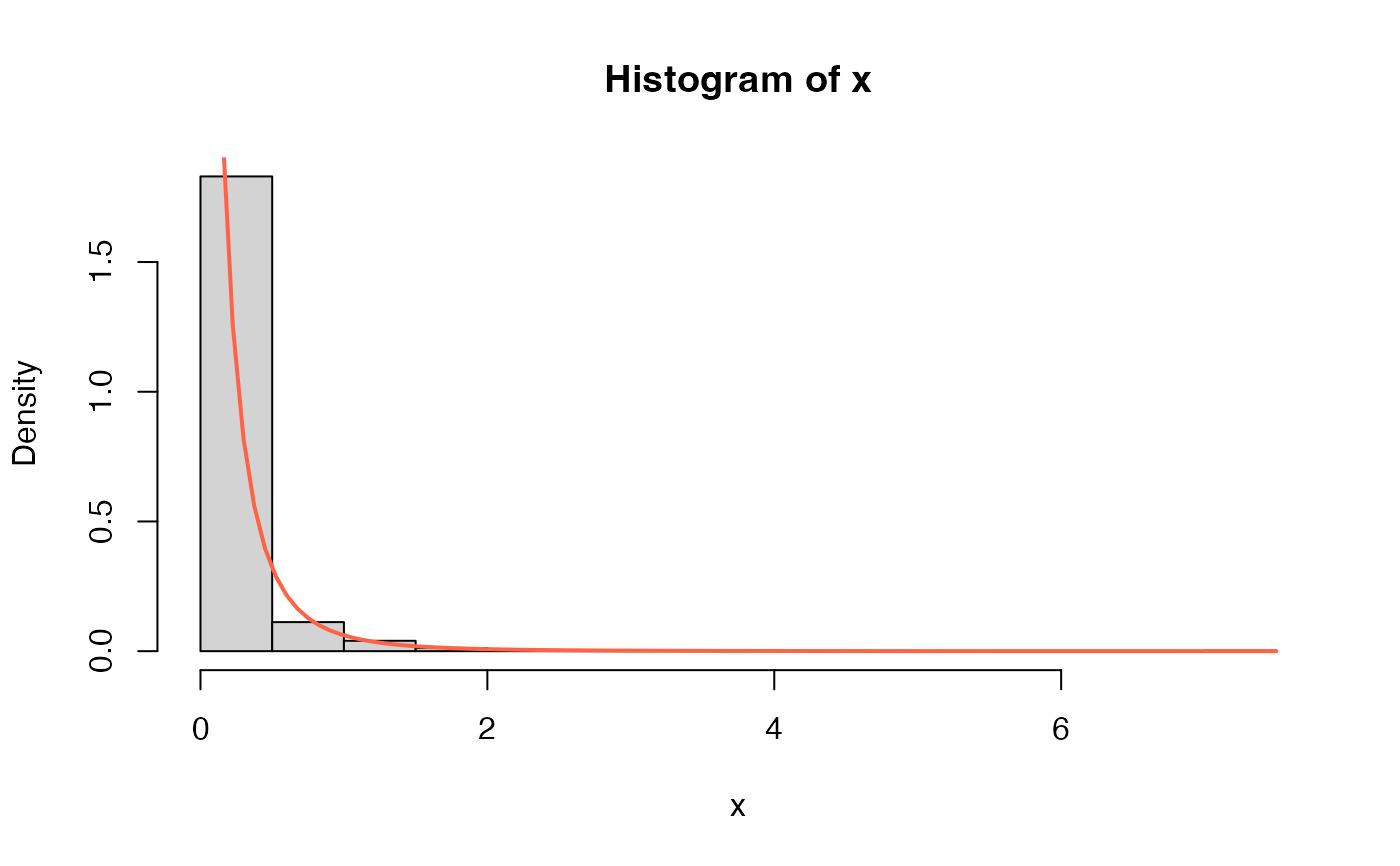
x <- rBTL(n=1000, mu=0.5, sigma=3, nu=1.5)
hist(x, freq=FALSE)
curve(dBTL(x, mu=0.5, sigma=3, nu=1.5), from=0,
add=TRUE, col="tomato", lwd=2)