Density, distribution function, quantile function,
random generation and hazard function for the Generalised exponential-Gaussian distribution with
parameters mu, sigma, nu and tau.
Usage
dGEG(x, mu = 0, sigma = 1, nu = 1, tau = 1, log = FALSE)

pGEG(q, mu = 0, sigma = 1, nu = 1, tau = 1, lower.tail = TRUE, log.p = FALSE)

qGEG(p, mu = 0, sigma = 1, nu = 1, tau = 1)

rGEG(n = 1, mu = 0, sigma = 1, nu = 1, tau = 1)
Arguments
- x, q
vector of quantiles.
- mu
parameter.
- sigma
parameter.
- nu
parameter.
- tau
parameter.
- log, log.p
logical; if TRUE, probabilities p are given as log(p).
- lower.tail
logical; if TRUE (default), probabilities are
P[X <= x], otherwise,P[X > x].- p
vector of probabilities.
- n
number of observations.
Value
dGEG gives the density, pGEG gives the distribution
function, qGEG gives the quantile function, rGEG
generates random deviates.
Details
The Generalised exponential-Gaussian with parameters mu, sigma, nu and tau
has density given by
\(f(x | \mu, \sigma, \nu, \tau) = \frac{\tau}{\nu} \exp(w) \Phi \left( z - \frac{\sigma}{\nu} \right) \left[ \Phi(z) - \exp(w) \Phi \left( z - \frac{\sigma}{\nu} \right) \right]^{\tau-1}\)
for \(-\infty < x < \infty\). With \(w=\frac{\mu-x}{\nu} + \frac{\sigma^2}{2\nu^2}\), \(z=\frac{x-\mu}{\sigma}\), and \(\Phi\) is the cumulative function for the standard normal distribution.
Examples
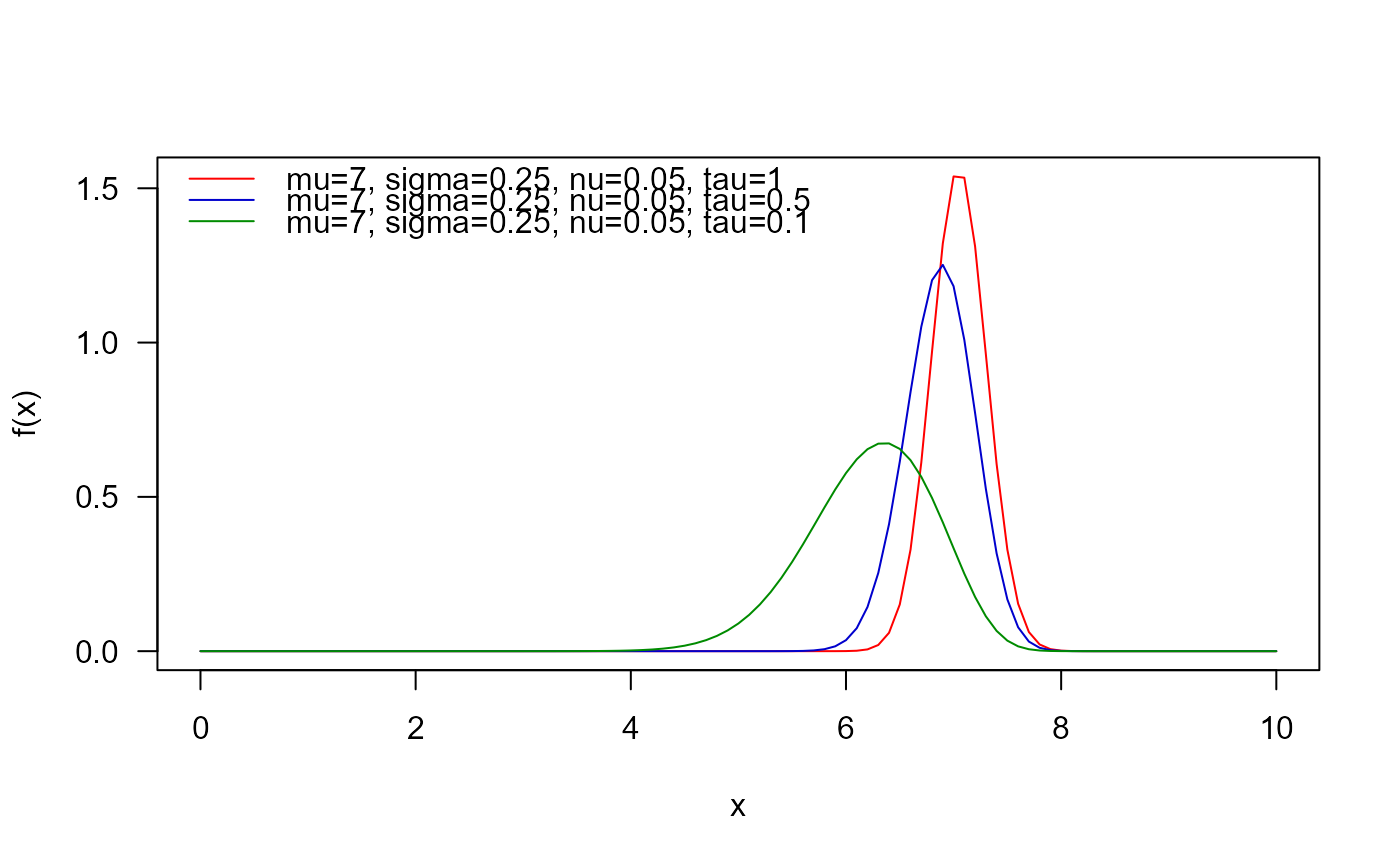
## The probability density function
curve(dGEG(x, mu=7, sigma=0.25, nu=0.05, tau=1),
      from=0, to=10, col="red", las=1, ylab="f(x)")

curve(dGEG(x, mu=7, sigma=0.25, nu=0.05, tau=0.5),
      add=TRUE, col="blue3")

curve(dGEG(x, mu=7, sigma=0.25, nu=0.05, tau=0.1),
      add=TRUE, col="green4")

legend("topleft", col=c("red", "blue3", "green4"), lty=1, bty="n",
       legend=c("mu=7, sigma=0.25, nu=0.05, tau=1",
                "mu=7, sigma=0.25, nu=0.05, tau=0.5",
                "mu=7, sigma=0.25, nu=0.05, tau=0.1"))


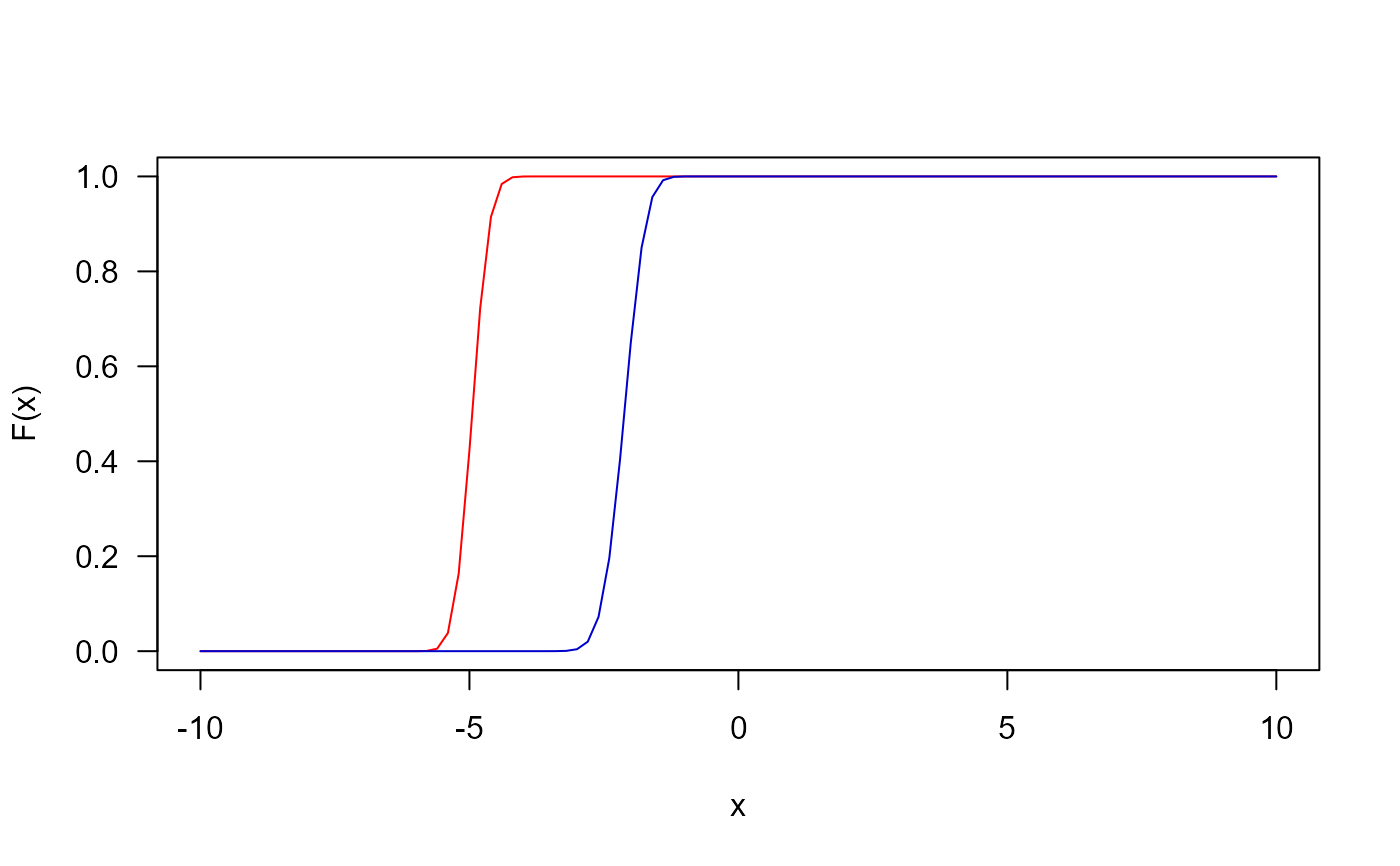
## The cumulative distribution function
curve(pGEG(x, mu=-5, sigma=0.25, nu=0.05, tau=1), from=-10, to=10,
      col="red", las=1, ylab="F(x)")
curve(pGEG(x, mu=-2, sigma=0.25, nu=0.05, tau=0.5),
      add=TRUE, col="blue3", las=1)


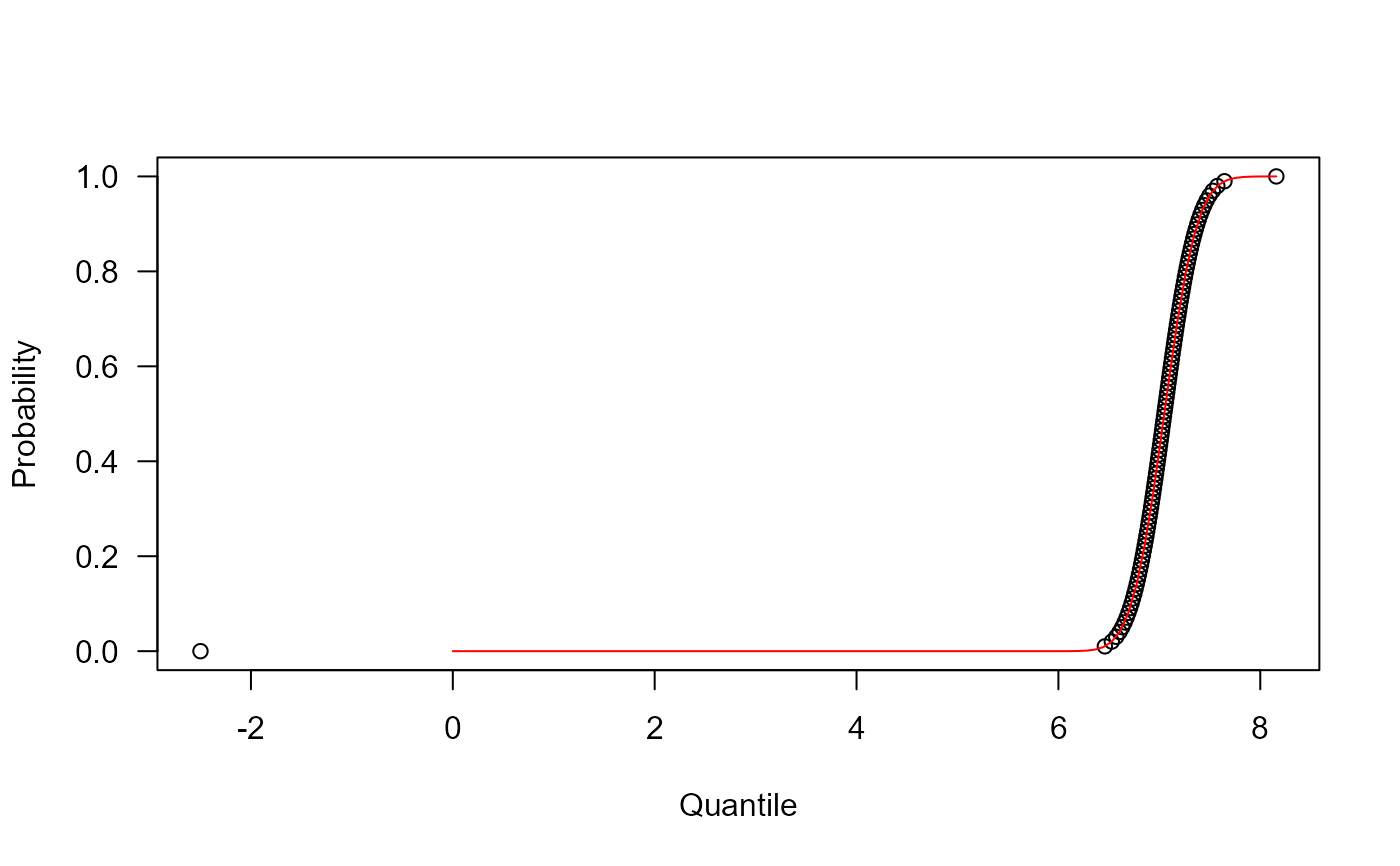
## The quantile function
p <- seq(from=0, to=0.99999, length.out=100)
plot(x=qGEG(p, mu=7, sigma=0.25, nu=0.05, tau=1), y=p, xlab="Quantile",
     las=1, ylab="Probability")
curve(pGEG(x, mu=7, sigma=0.25, nu=0.05, tau=1), from=0, add=TRUE, col="red")


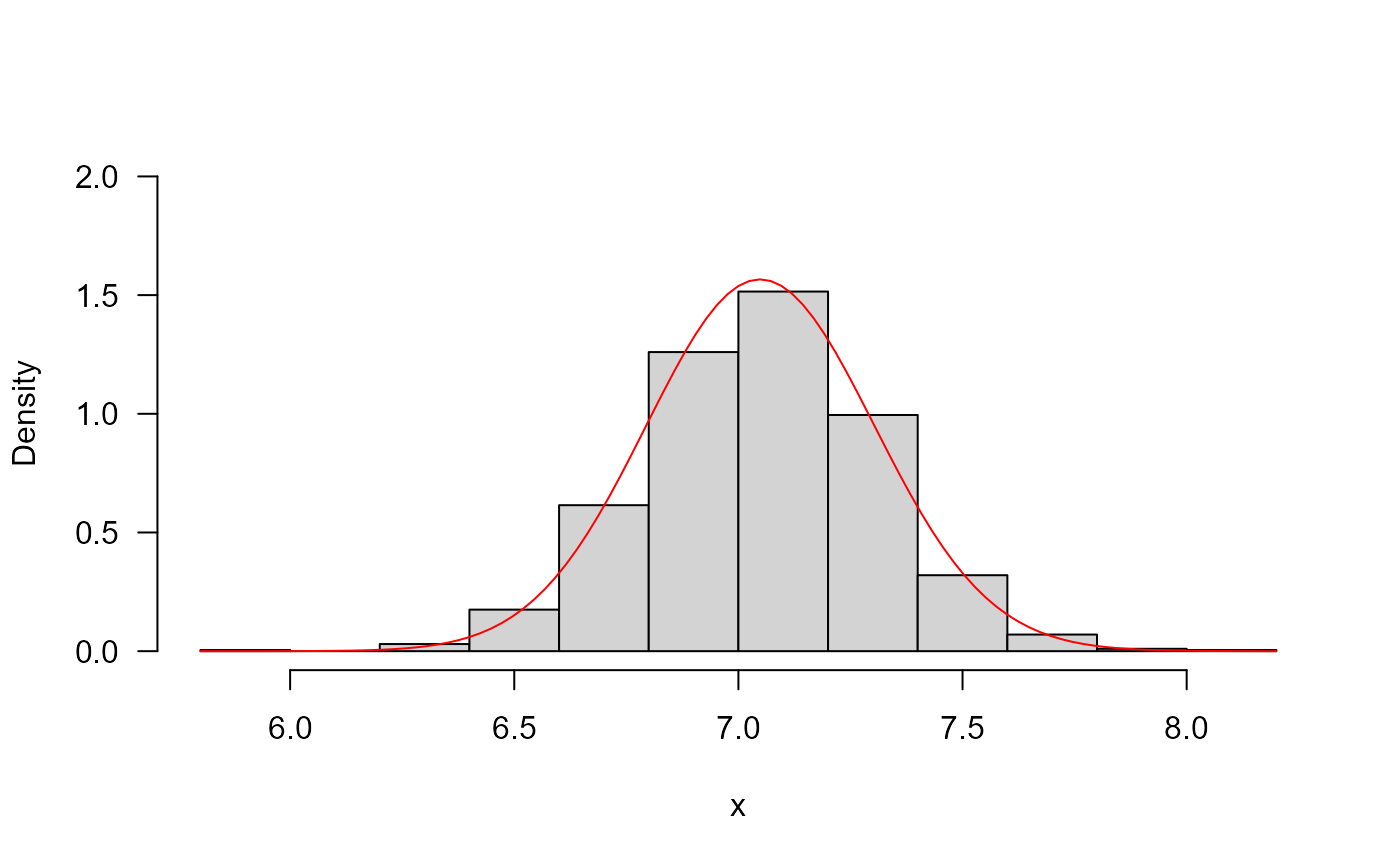
## The random function
hist(rGEG(n=1000, mu=7, sigma=0.25, nu=0.05, tau=1), freq=FALSE, xlab="x",
     ylim=c(0, 2), las=1, main="")
curve(dGEG(x, mu=7, sigma=0.25, nu=0.05, tau=1), add=TRUE, col="red")
